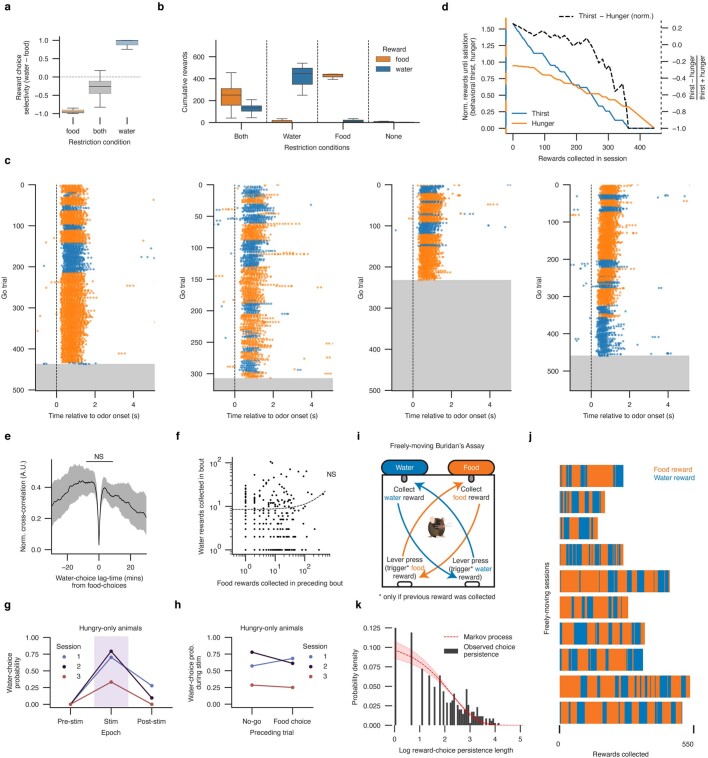
Extended Data Fig. 1. Quantification of behavior in Buridan’s assay.
a, Choice selectivity [(water choices – food choices)/(food choices + water choices)] in Buridan’s assay under different restriction conditions. b, Cumulative food and water rewards collected for each restriction condition. Boxplots in a, b show data ranging from the lower quartile to the upper quartile, whiskers extend to 1.5-times the inter-quartile range. n = 15 mice, 22 sessions for food and water restriction, n = 3 mice, 3 sessions for both water restriction only and food restriction only; n = 2 mice, 2 sessions for no restrictions. c, Additional example behavior sessions. Each row shows licking behavior (food licks, orange dots; water licks, blue dots) during a trial. Grey region, sated non-responses. d, Example calculation of behavioral thirst, behavioral hunger, and relative need [Thirst – Hunger (norm.) = (thirst – hunger)/(thirst + hunger)] for a behavioral session. Behavioral thirst and hunger are normalized by their median values across all sessions. e, f, Food choices do not significantly induce water choices on the timescale of Buridan’s assay. e, Normalized cross-correlation plot indicating lag time between water choices and food choices. The normalized cross correlation is not significantly different from a zero lag-time (1-sample two-sided T-test, t = –1.45, P = 0.16). A significant positive or negative lag time would indicate that food choices induce water choices or water choices induce food choices, respectively. Mean ± 95% confidence interval, n = 15 mice, 22 sessions. f, Number of water rewards collected in a given bout (y-axis) vs. the number of food rewards collected in the previous bout (x-axis), both log-scaled. Dots, rewards in bout; dashed line, linear fit. No significant (NS) relationship was found between water rewards in a bout and the number of food rewards in a previous bout (R2 = 0.0063, P = 0.185). g, h, Additional quantification of optogenetic thirst stimulation in hungry animals during Buridan’s assay. g, Probability of water choices before (–20 s to –10 s before stimulation onset), during (0.5 s to 10 s after stimulation onset), or after (30 s to 40 s after stimulation onset) optogenetic stimulation, plotted for each of the three sessions. h, Comparison of the water-choice probability during stimulation for epochs following food choices or No-Go trials. No significant influence of previous trial outcome is found on the subsequent stimulation epoch water-choice probability (two-sided paired t-test, t = 0.37, P = 0.747). Blue and black markers indicate data from one animal; the red marker indicates data from a second animal. Each session contains 30 optogenetic stimulation epochs. i–k, A freely moving version of Buridan’s assay. i, Schematic. Hungry and thirsty mice are placed in a behavioral chamber in which incremental salted liquid food or water rewards are dispensed from spouts upon pressing of the corresponding food or water lever on the opposite wall of the chamber. Rewards must be collected from a given spout before subsequent lever presses dispense additional rewards. Spouts and their corresponding reward levers are placed diagonally across from each other in the chamber, such that the mouse must pass through the center of the chamber (equidistant from both food and water levers). There are no choice-cues in this assay: the mice are free to initiate or stop lever pressing and reward collection at any time. Mice were trained in the arena until proficient at collecting corresponding rewards following lever presses. j, Food (orange) and water (blue) reward collection sequences for 6 mice across 10 sessions (rows). k, Choice persistence length (# repeated rewards of the same kind before switching) distribution across the 10 sessions. Dashed red line and shaded region, fit geometric distribution corresponding to a sticky Markov process, mean shape parameter P = 0.097 ± 95% confidence interval [0.086, 0.108].

