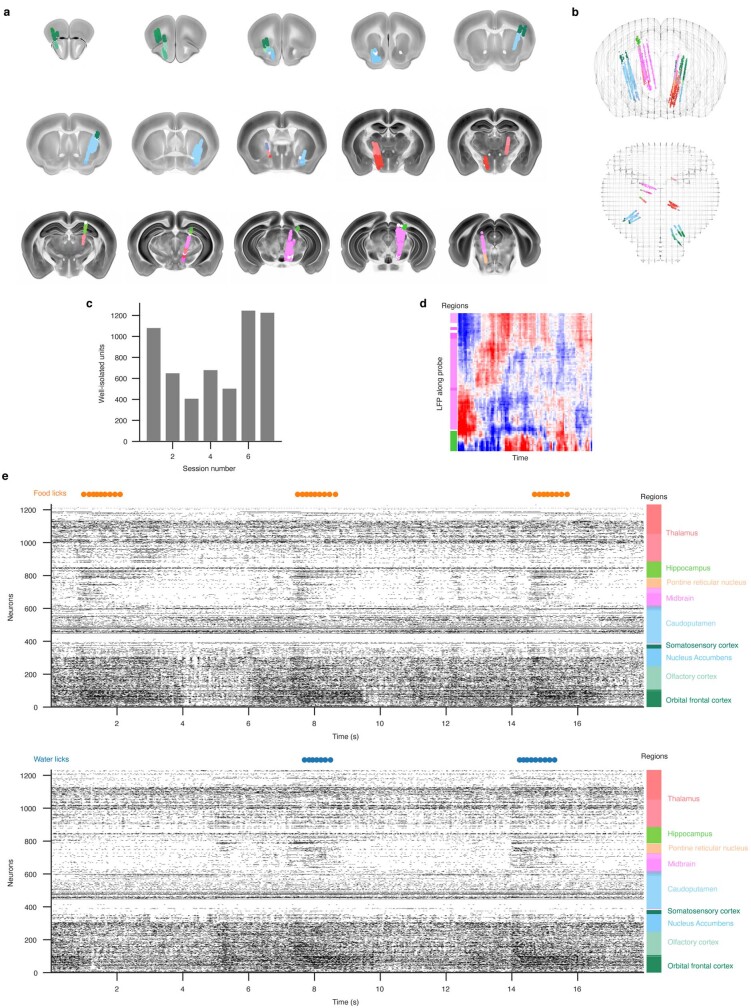
Extended Data Fig. 2. Unit anatomy and additional data in Neuropixels-based extracellular electrophysiological recordings.
a, All well-isolated single unit locations plotted onto nearby coronal sections of the Allen Institute CCF3 2017 reference atlas. Units are color coded by the identity of the region they were assigned to according to the Allen Atlas reference colormap (Extended Data Table 1; see also panel e, right). b, Well-isolated unit locations color-coded by region assignment and plotted onto coronal (top) and horizontal (bottom) atlas projections. c, Counts of well-isolated units (passing quality control thresholds) that were simultaneously recorded per session. Each session is collected from a different mouse. d, Depth of electrodes along the insertion axis of an example probe mapped to region (color bars on the left) and aligned to local field potential (LFP) data in a 400-ms time window. e, Spiking activity from a single session over two 12-s time windows. Panel tops, licking for food (orange) and water (blue). Colorbars, region assignments aligned to individual neurons. Regions and region labels are color coded according to the Allen Brain Atlas colormap.

