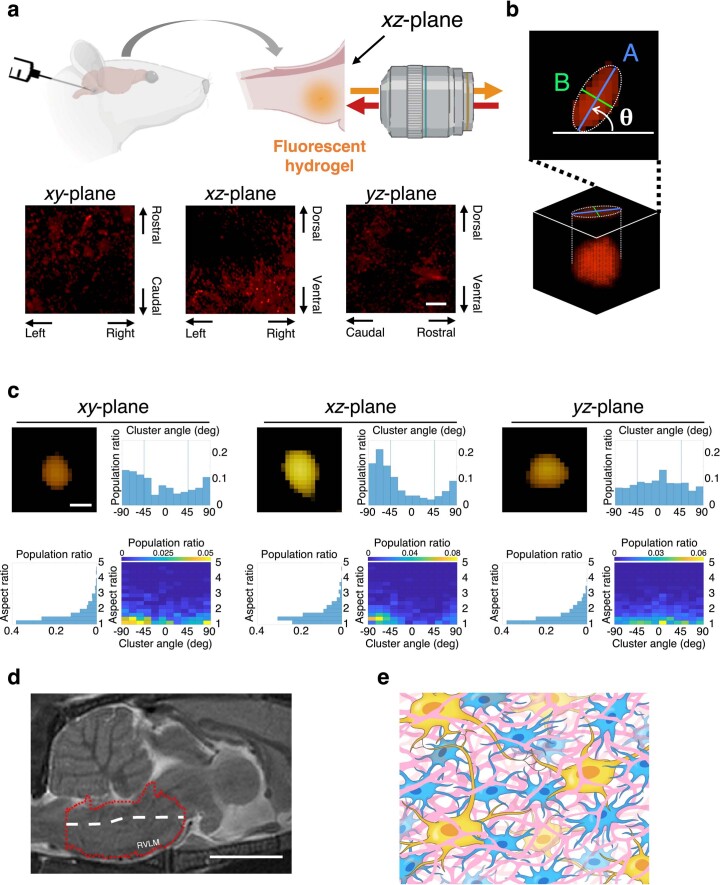
Extended Data Fig. 6. Structure and orientation of interstitial space in the rat RVLM.
a, Multiphoton microscopic imaging of fluorescent hydrogel-introduced rat RVLM in three mutually orthogonal planes. Top: schematic illustration of hydrogel introduction and xz-plane imaging. Bottom: processed volume images (see Methods) of interstitial space-representing fluorescence clusters projected onto the xy-, xz-, and yz-planes. Scale bar, 20 μm. b, Determination of the cluster angle and calculation of the aspect ratio. Interstitial space-representing fluorescence clusters were extracted, and their projection and elliptic fitting on the stacked plane were conducted as described in the Methods. The cluster angle (θ) in degrees was defined and analysed as positive (counter-clockwise; see arc arrow) or negative (clockwise) from the horizontal line in each plane. The aspect ratio was calculated as A/B. c, Distribution of the cluster angle and aspect ratio. Volume image of a cluster of typical shape and orientation (top left), histograms of the angle distribution (top right) and aspect ratio (bottom left), and 2-D histogram of the cluster orientation/aspect ratio (bottom right) are shown for the xy-, xz-, and yz-planes. From the location of seemingly unimodal peaks in the 2-D histograms for the xy- and xz-planes, the y- and z-axes appear to be dominant over the x-axis concerning the cluster orientation. Furthermore, the y-axis appears slightly dominant over the z-axis (loose peak on the 0–15° block in the yz-plane). Scale bar, 1 μm. d, Representative sagittal MR image of the rat brainstem (0.06 mm off the median plane). Red dotted line-indicated area and white broken line represent the lower brainstem and longest centroidal line of this part of the brain, respectively (see Methods). Note that the centroidal line is approximately along the y-axis with a slight rostrally upward inclination. Scale bar, 5 mm. Data shown in (c,d) represent at least three biologically independent samples (rats) with similar results. e, Diagram of the mesoscale structure/orientation of interstitial space in the rat RVLM. The interstitial space (depicted in pink) is not randomly structured but oriented approximately along the direction of the centroidal line of this part of the brain with relatively minor lateral communications. Blue and yellow cells represent astrocytes and neurons, respectively.

