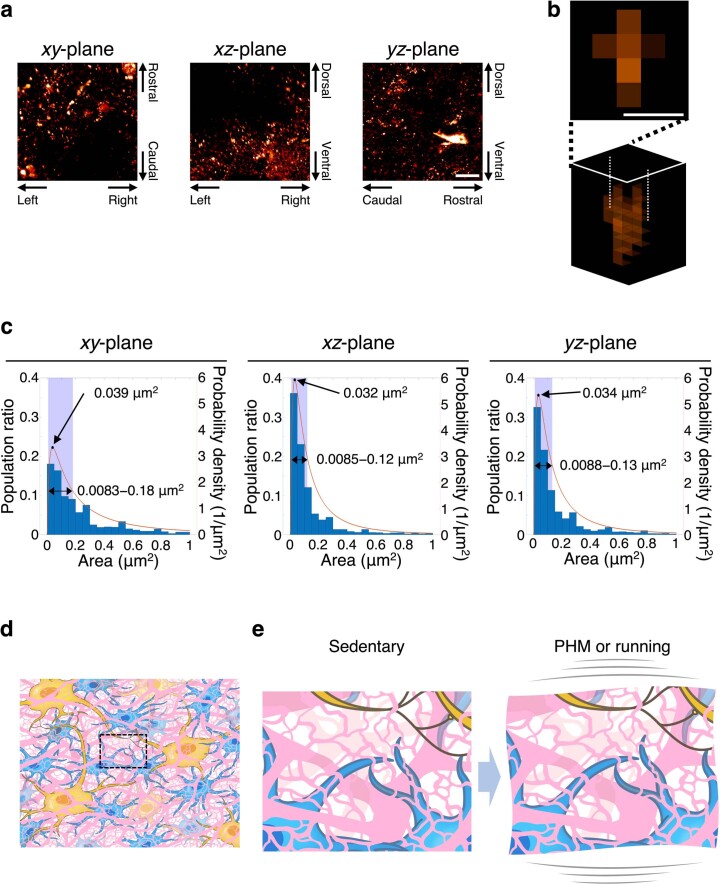
Extended Data Fig. 7. Dimension (cross-sectional area) of interstitial space in the rat RVLM.
a, Multiphoton microscopic images of interstitial space-representing fluorescence clusters projected onto xy- (left), xz- (center), and yz- (right) planes. Scale bar, 20 μm. b, Projection of 4-μm stack images of an individual cluster. White dotted lines indicate the ends of the long axis of the cluster. Scale bar, 0.5 μm. c, Distribution of the cross-sectional areas of individual clusters. Red curves represent the probability densities revealed by fitting to log-normal distribution112,113, and black circles indicate the modes. Two-way arrows are located at the half maximum, and purple zones indicate the full widths at half maximum (FWHM)114. d, Diagram of the interstitial space in the rat RVLM. Dotted rectangle indicates the area illustrated in (e). Because we analysed the interstitial space with imaging experiments based on the spread of the injected gelling fluorescent PEG solutions, we assumed the interstitial space to have a continuous structure. Nevertheless, we do not preclude the possible existence of dead ends of interstitial space. e, Illustration of cyclic microdeformation during PHM or treadmill running that generates small pressure changes in the rat RVLM, facilitating or promoting interstitial fluid movement in situ. Interstitial spaced is depicted in pink, and blue and yellow cells represent astrocytes and neurons, respectively, in (d,e).

