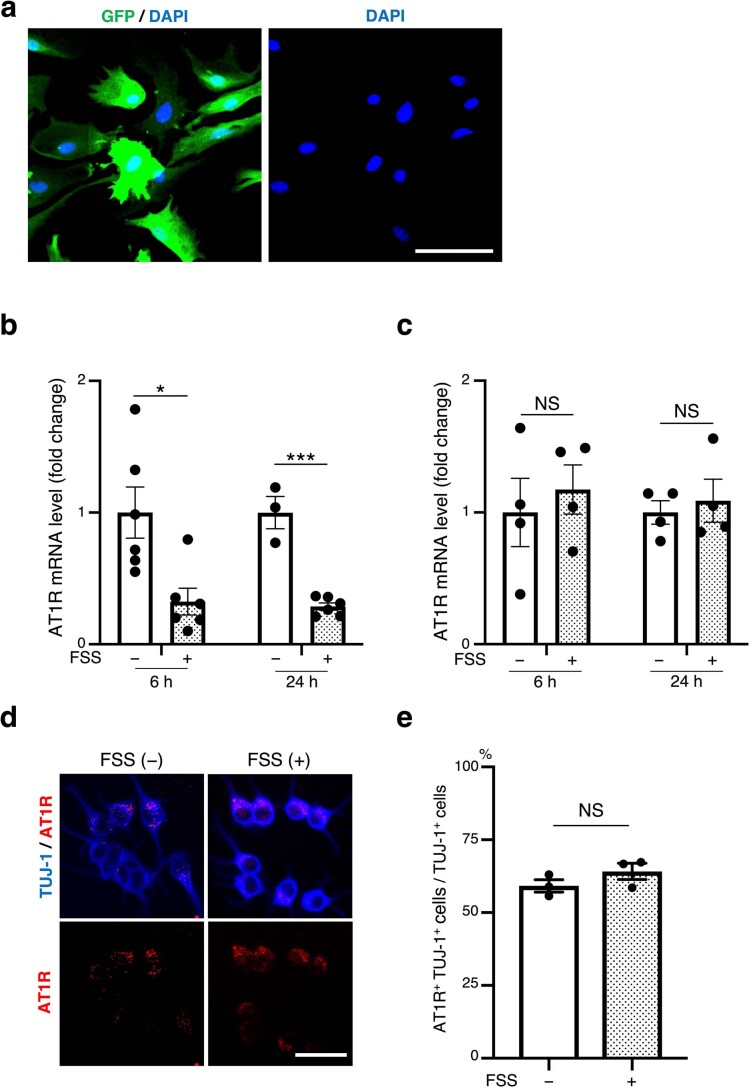
Extended Data Fig. 8. Preparation of astrocyte-enriched primary culture, and lack of a decreasing effect of FSS on AT1R expression in cultured neuronal cells.
a, Representative micrographic image of anti-GFP immunostaining (green) and DAPI staining (blue) of astrocyte-enriched culture prepared from the astrocyte-GFP mice. Scale bar, 50 μm. Note that most of the cells are GFP-positive. b,c, Effects of FSS on the AT1R mRNA expression in astrocytes and Neuro2A cells. AT1R mRNA expression in cultured astrocytes (b) and Neuro2A cells (c) 6 or 24 h after 30-min FSS application (0.7 Pa, 0.5 Hz) was analysed as in Fig. 5a [b: P = 0.0116 for 6 h, P < 0.0001 for 24 h. n = 6 for 6 h; n = 3 for 24 h/FSS (−); n = 6 for 24 h/FSS (+). c: P = 0.6065 for 6 h, P = 0.6490 for 24 h. n = 4 for each group]. d, Microscopic images of anti-AT1R (red) and anti-TUJ-1 (blue) immunostaining of Neuro2A cells, either left unexposed or exposed to pulsatile FSS (0.7 Pa, 0.5 Hz, 30 min), and fixed 24 h after the intervention. Images are representative of three biologically independent experiments with similar results. Scale bar, 50 μm. e, Relative population of AT1R/TUJ-1/ double positive (AT1R+ TUJ-1+) cells quantified as a ratio to total TUJ-1-positive (TUJ-1+) cells in each sample (P = 0.2308. More than 100 TUJ-1-positive cells were analysed in each sample. n = 3). Data are presented as mean ± s.e.m. *P < 0.05; ***P < 0.001; NS, not significant; unpaired two-tailed Student’s t-test (b,c,e).

