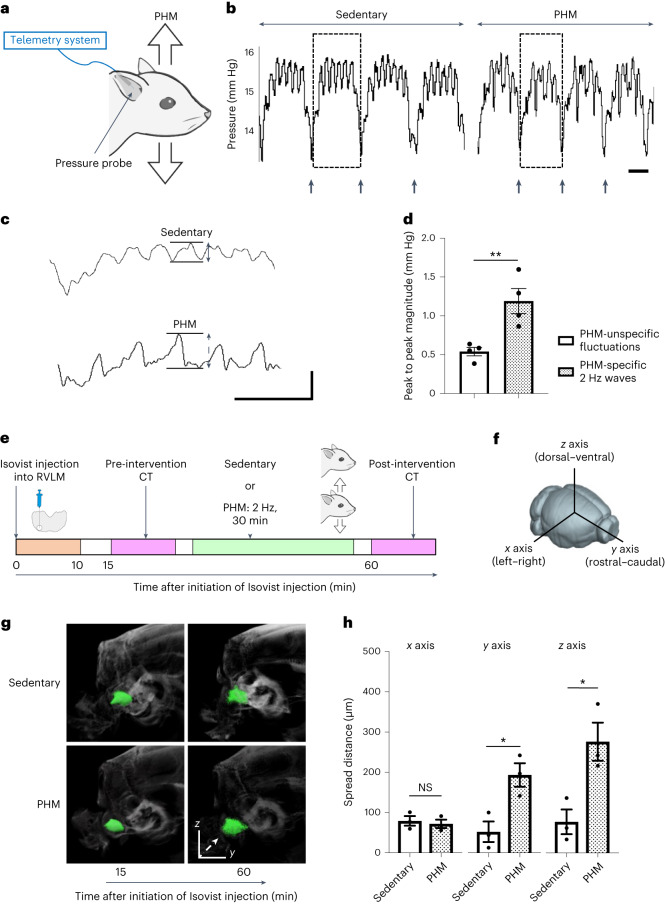
Fig. 4. PHM generates pressure waves of low amplitude, and facilitates interstitial-fluid movement (flow) in the rat RVLM.
a, Schematic of the pressure measurement in the rat RVLM. b, Representative pressure waves recorded in the rat RVLM during the sedentary condition and PHM. The arrows indicate the time of transition from inhalation to exhalation detected by simultaneous respiration monitoring. Scale bar, 1 s. Images are representative of four biologically independent experiments with similar results. c, Respiration-unsynchronized pressure changes. The respiration-synchronized pressure waves indicated by dotted rectangles in b are presented at a high magnification. Scale bars, 1 s (horizontal) and 1 mm Hg (vertical). Note that the 2 Hz pressure waves indicated by a two-headed dotted line arrow were specifically generated during PHM. d, The magnitude of PHM-specific and PHM-unspecific pressure changes unsynchronized with respiration. The peak-to-peak magnitudes indicated by two-headed arrows in c were quantified (P = 0.0089). n = 4 rats for each group, 10 segments analysed for each rat. e, Schematic of the experimental protocol for the μCT analysis of Isovist injected into the rat RVLM. f, Definition of the x (left–right), y (rostral–caudal) and z (dorsal–ventral) axes used in this study. g, Representative Isovist spread presented on X-ray images. Isovist clusters are shown in green. The images in each row are from an individual rat, representative of three rats. The dashed arrow indicates the main direction of spreading in this sample. h, Quantification of Isovist spread along each axis (P = 0.6666 (left), P = 0.0218 (middle), P = 0.0244 (right)). n = 3 rats per group. Data are mean ± s.e.m. Statistical analysis was performed using unpaired two-tailed Student’s t-tests; *P < 0.05, **P < 0.01.

