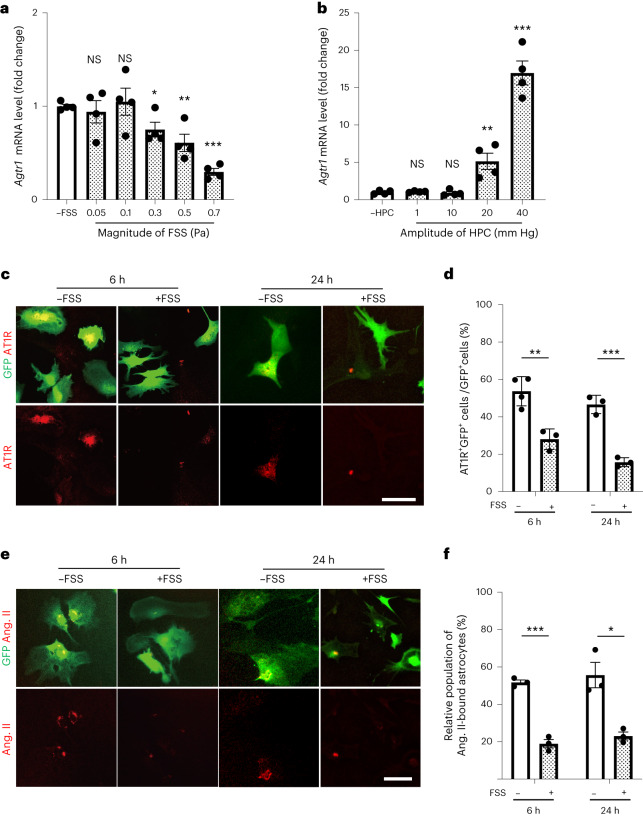
Fig. 5. Fluid shear stress on cultured astrocytes decreases their AT1R expression and angiotensin-II-binding potential in vitro.
a–d, AT1R expression in cultured astrocytes with or without exposure to fluid shear stress or HPC. Astrocytes prepared from the astrocyte-GFP mice, either left unexposed or exposed to pulsatile fluid shear stress (average 0.05–0.7 Pa, 0.5 Hz, 30 min) (a) or cyclical HPC (1–40 mm Hg, 0.5 Hz, 30 min) (b) were solubilized 24 h after the termination of intervention, and analysed using qPCR. Agtr1 mRNA expression levels were normalized to Gapdh expression and scaled with the mean value from control samples (cells left unexposed to fluid shear stress or HPC) set as 1. c, Microscopy images of anti-AT1R (red) and anti-GFP (green) immunostaining of cultured astrocytes that were either left unexposed or exposed to pulsatile fluid shear stress (0.7 Pa, 0.5 Hz, 30 min) and fixed 6 or 24 h after the intervention. Images are representative of three or four biologically independent experiments with similar results. Scale bar, 50 μm. d, Relative population of AT1R+GFP+ double-positive cells (cells were quantified as a ratio to total GFP+) in each sample. e,f, The effect of fluid shear stress on the angiotensin-II-binding potential of astrocytes. Cultured astrocytes were either left unexposed or exposed to fluid shear stress as described in a, c and d. Six or twenty-four hours after the cessation of the 30 min application of fluid shear stress (0.7 Pa, 0.5 Hz), cells were analysed using a fluorescent angiotensin-II-binding assay. e, Microscopy images. Images are representative of three biologically independent experiments with similar results. Scale bar, 50 μm. f, GFP+ cells with punctate red fluorescence (TAMRA–angiotensin-II-bound astrocytes) were quantified as the ratio (%) to total GFP+ cells in each sample. The images in each column of c and e are from an individual sample. Data are mean ± s.e.m. Statistical analysis was performed using unpaired two-tailed Student’s t-tests; *P < 0.05, **P < 0.01, ***P < 0.001. Details of the statistical analyses are provided in the Supplementary Information.

