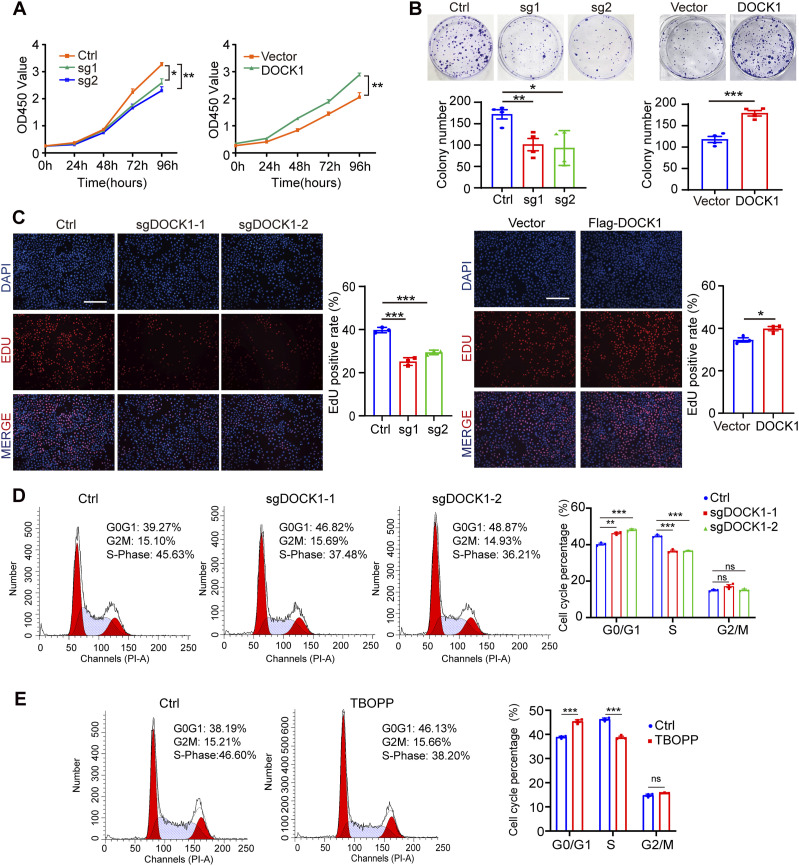
Figure 2. DOCK1 modulates cell proliferation and cell cycle progression.
(A) CCK-8 assay results showing the viability of HTR-8 cells after DOCK1 repression or overexpression. (B) Cell colony formation assays to determine the clonogenicity of HTR-8 cells after DOCK1 repression or overexpression (top), and cell quantification (bottom). (C) Edu assay results showing the proliferation of HTR-8 cells after DOCK1 repression or overexpression (left). The Edu-positive rate was quantified (right). Scale bar: 200 μm. (D) Flow cytometry analysis showing the distribution of HTR-8 cells among G0/G1-, S-, and G2/M-phases after DOCK1 knockout (left), and percentage analysis of cells in each phase relative to the total (right). (E) After HTR-8 cells were treated with DOCK1 inhibitor 10 μM TBOPP for 24 h, cell cycle distribution was analyzed by flow cytometry (left). The respective percentages of cells in each phase are presented (right). In (A, C, D, E), each group, n = 3 biological replicates (*P < 0.05; **P < 0.01; ***P < 0.001; unpaired two-tailed t test). In (B), each group, n = 4 biological replicates (*P < 0.05; **P < 0.01; ***P < 0.001; unpaired two-tailed t test).

