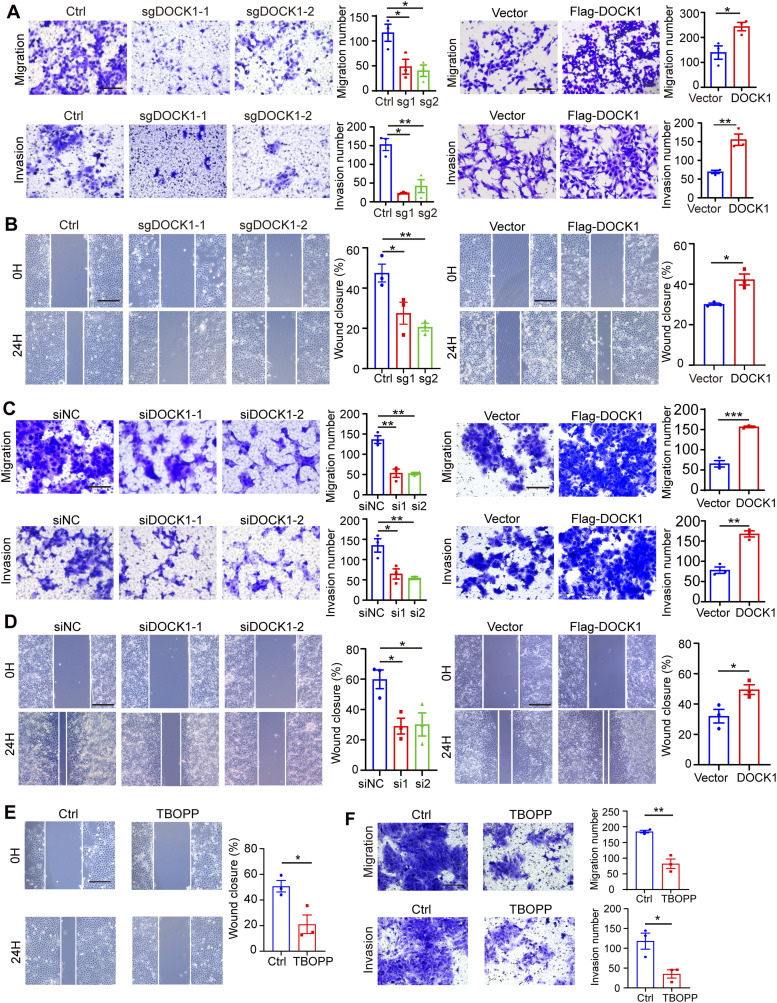
Figure 3. DOCK1 promotes the migration and invasion.
(A) Transwell assay results showing the migration and invasion of HTR-8 cells DOCK1 depletion or overexpression (left). The number of migrating and invading cells was quantified (right). Scale bar: 100 μm. (B) Wound healing assay results showing the migration of HTR-8 cells after DOCK1 repression or overexpression (left). The rate of wound closure was quantified (right). Scale bar: 200 μm. (C) Transwell assay results showing JAR cell migration and invasion after DOCK1 inhibition or overexpression (left) and quantification of migrating or invading cells (right). Scale bar: 100 μm. (D) Wound healing assays results showing JAR cell migration after DOCK1 repression or overexpression (left) and quantification of rate of wound closure (right). Scale bar: 200 μm. (E) Wound healing assay results showing the migration ability of HTR-8 cells after treatment with 10 μM TBOPP (left) and quantification of rate of wound closure (right). Scale bar: 200 μm. (F) Transwell assays showing the migration and invasion ability of HTR-8 cells after TBOPP treatment (left). The number of migrating and invading cells was calculated (right). Scale bar: 100 μm. In (A, B, C, D, E, F), each group, n = 3 biological replicates (*P < 0.05; **P < 0.01; ***P < 0.001; unpaired two-tailed t test).

