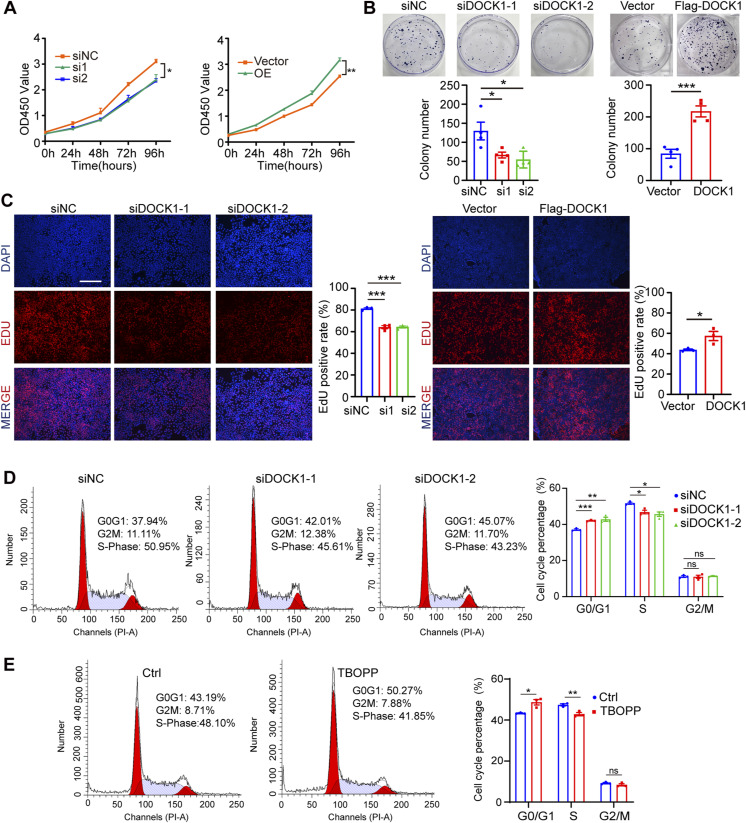
Figure S2. DOCK1 modulates cell proliferation and cell cycle progression.
(A) CCK-8 assay results showing the viability of JAR cells after DOCK1 repression or overexpression. (B) Cell colony formation assay results showing the clonogenicity of JAR cells after DOCK1 repression or overexpression (top) and cell quantification (bottom). (C) Edu assay results showing JAR cell proliferation after DOCK1 repression or overexpression (left) and quantification of Edu-positive cells (right). Scale bar: 200 μm. (D) Flow cytometry analysis showing cell cycle distribution for JAR cells after DOCK1 inhibition (left) and the relative percentage analysis (right). (E) JAR cells were treated with 10 μM TBOPP for 24 h. The distribution of cell cycle was analyzed by flow cytometry (left). The relative percentages of cells in each phase are depicted (right). In (A, C, D, E), each group, n = 3 biological replicates (*P < 0.05; **P < 0.01; ***P < 0.001; unpaired two-tailed t test). In (B), each group, n = 4 biological replicates (*P < 0.05; ***P < 0.001; unpaired two-tailed t test).

