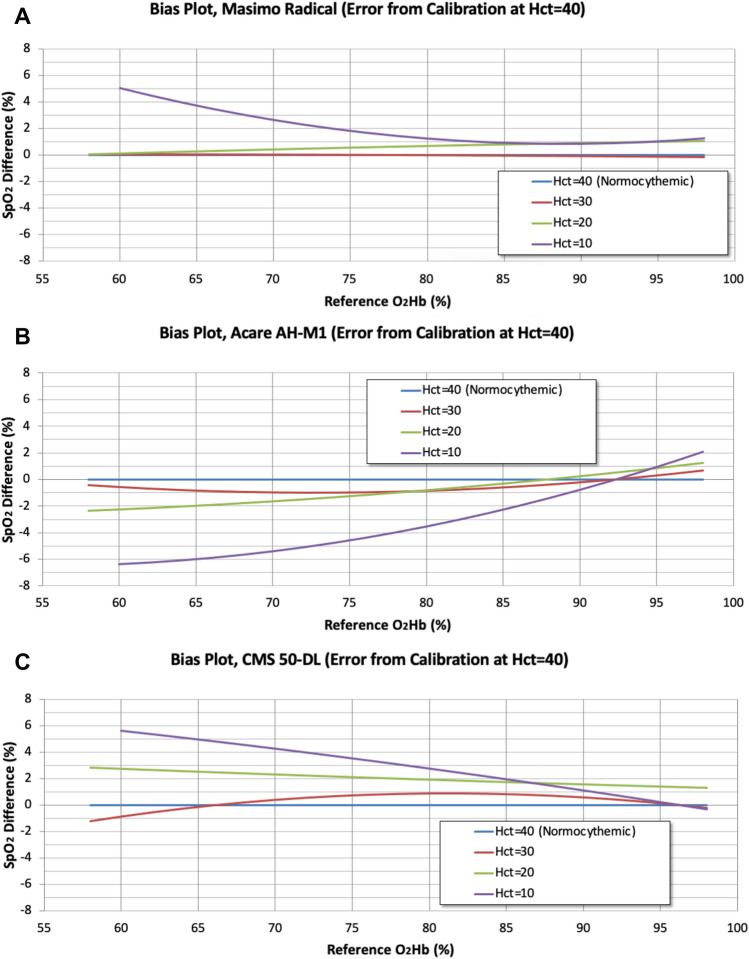
Fig. 3.
a–c Bias plots showing errors in SpO2 measurement as a function of reference oxygen saturation (O2Hb) and hematocrit (Hct). Errors shown are the differences in saturation measurements from those obtained for Hct = 40; therefore, by definition, the zero-error line is the Hct = 40 line. To obtain the curves shown in these plots, the curve fit for Hct = 40 was subtracted from the curve fit at each of the other hematocrit levels. The Hct = 10 and 20 curves for the CMS 50-DL oximeter were truncated below 58% O2Hb

