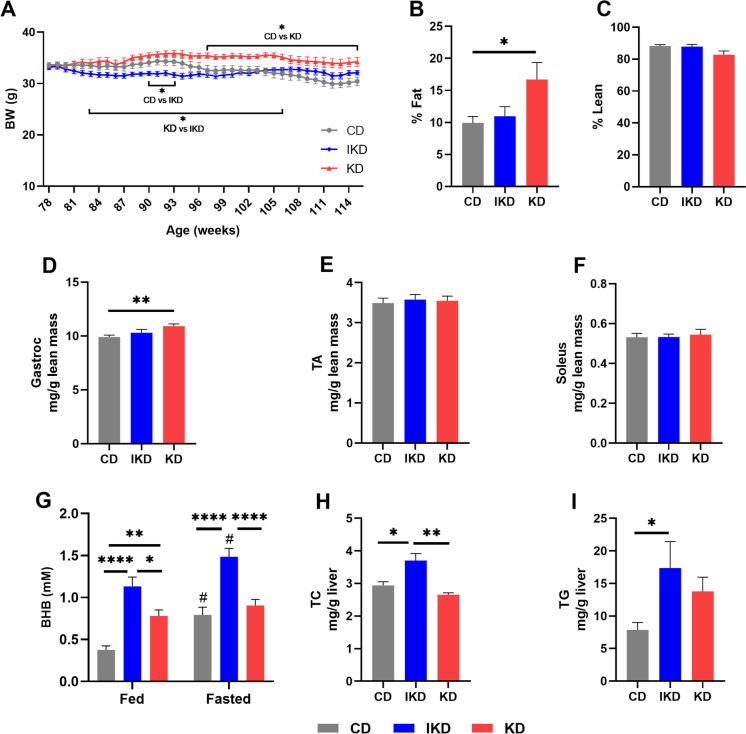
Fig. 1.
Differential adaptation of 18-month male mice to a KD or IKD. (A) Body weights of CD, IKD, and KD mice throughout the study (n = 19–20/group). (B–C) Percent fat (B) and lean (C) mass measured using EchoMRI at 27 months of age (n = 10–12/group). (D–F) Relative mass of gastrocnemius (D), tibialis anterior (E), and soleus (F) muscle to total lean mass (n = 10–12/group). (G) Circulating level of β-hydroxybutyrate (n = 19–20/group). (H–I) Content of liver total cholesterol (H) and triglyceride (I) (n = 8/group). Diets: CD—control, IKD—intermittent ketogenic, KD—ketogenic. ∗ p < 0.05, ∗ ∗ p < 0.01, ∗ ∗ ∗ ∗ p < 0.0001, #p < 0.05 between fasted vs. fed ketone levels, based on repeated measures two-way ANOVA or one-way ANOVA followed with Tukey’s multiple comparisons tests

