FIG. 3.
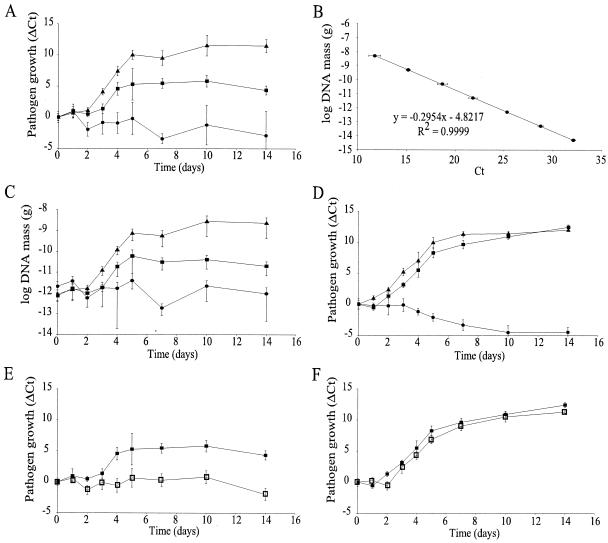
kPCR-derived Melampsora growth curves for different poplar host backgrounds. Poplar clones Jackii (▴), NM6 (▪), and 717 (•) were chosen for their different levels of resistance to M. medusae. (A) M. medusae growth curves for three different poplar clones with different levels of resistance. (B) Standard curve used for conversion of Ct values to pathogen DNA mass. The equation resulting from linear regression of the standard curve is shown. (C) M. medusae DNA mass growth curves for three different poplar clones. (D) M. larici-populina growth curves for three different poplar clones. (E and F) M. medusae (E) and M. larici-populina (F) growth curves for the chitinase-overexpressing line CH-11 (□) and the wild-type background clone NM6 (▪). The values are the means ± standard deviations for four different biological samples assayed in triplicate (n = 12).

