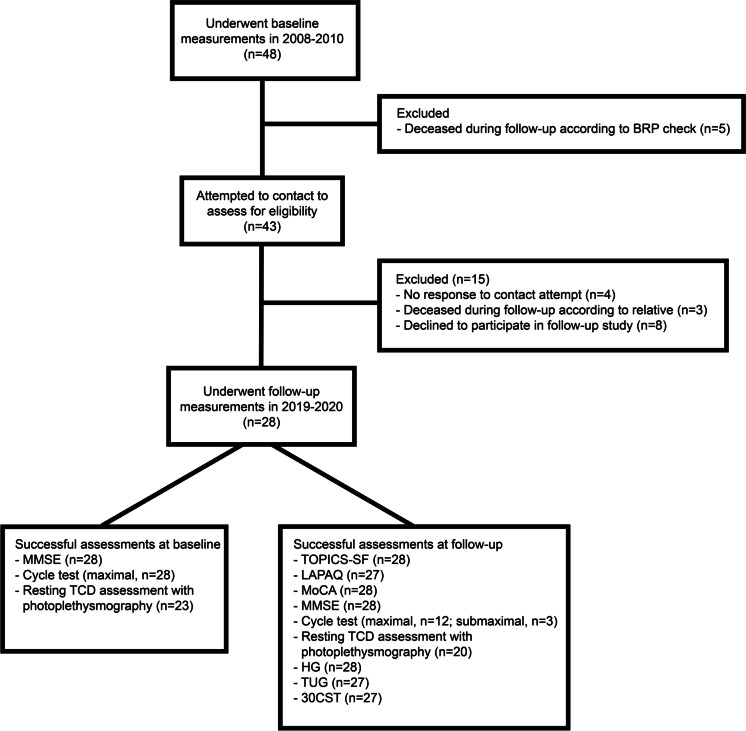
Fig. 1.
CONSORT-style flowchart diagram. Flowchart diagram showing the flow of participants from the original study population at baseline to inclusion in the present follow-up study, together with numbers of successful assessments for each type of measurement at both baseline and follow-up. Abbreviations: 30CST 30-s chair stand test, BRP Dutch Personal Records Database, HG maximal handgrip strength, LAPAQ Longitudinal Ageing study Amsterdam Physical Activity Questionnaire, MMSE Mini-Mental State Examination, MoCA Montreal Cognitive Assessment, TCD transcranial Doppler, TOPICS-SF The Older Persons and Informal Caregivers Survey - Short Form, TUG Timed Up & Go. Adobe Illustrator (2021) was used to create Fig. 1

