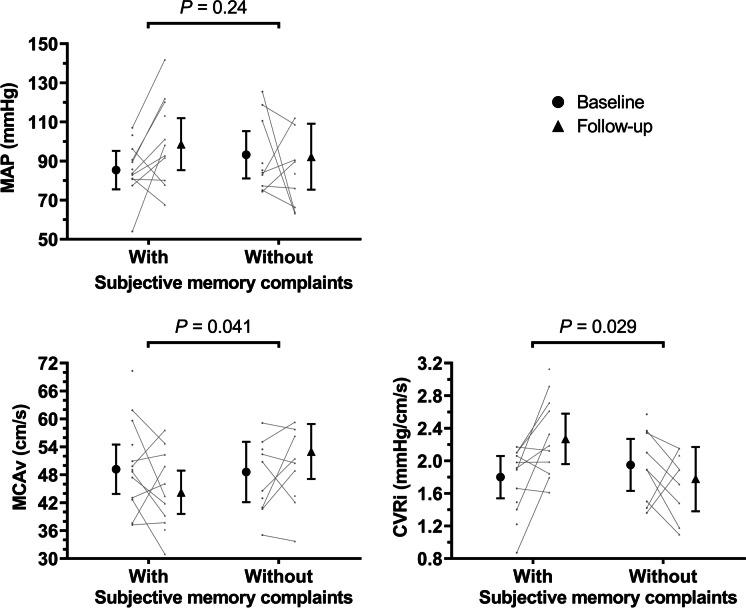
Fig. 2.
Longitudinal changes in cerebrovascular parameters in participants with and without subjective memory complaints. Graphs show estimated marginal means with 95% CI for MAP, MCAv, and CVRi at baseline (black circles) and after follow-up (black triangles) in participants with and without subjective memory complaints. Small gray data points show individual values available at each timepoint, with connecting lines indicating changes within participants. P values represent significance levels for the time-by-memory complaints interaction effect derived from the linear mixed-model analyses. Abbreviations: CVRi cerebrovascular resistance index, MAP mean arterial pressure, MCAv mean bilateral middle cerebral artery blood velocity. GraphPad Prism (version 9.3.1) was used to create Fig. 2

