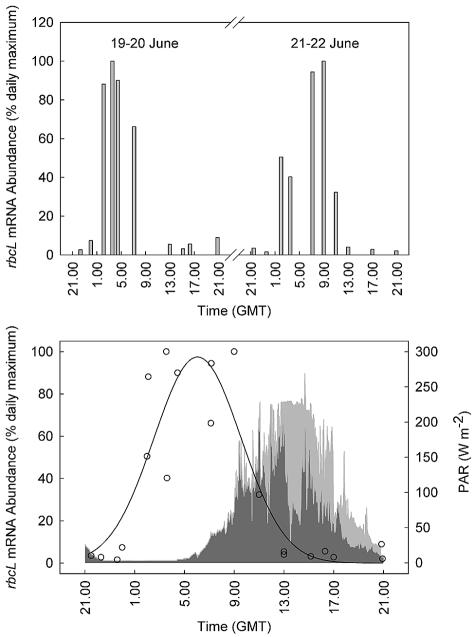
FIG. 3.
Diel variability in the abundance of C. pelagicus rbcL mRNA normalized to the maximum hybridization signal recorded during each diel cycle (top panel). The bottom panel shows a three-parameter Gaussian regression (SigmaPlot for Windows, version 8.02) of the combined data set from both diel cycles and the temporal variability in photosynthetically active radiation (PAR) in the 24-h period between 2100 on 19 June and 2100 on 20 June (light gray) and the 24-h period between 2100 on 21 June and 2100 on 22 June (dark gray). The temporal resolution of the irradiance data is 1 min and was logged with a 4π collector mounted on the unshaded upper deck of the research vessel. GMT, Greenwich mean time.

