Fig. 1.
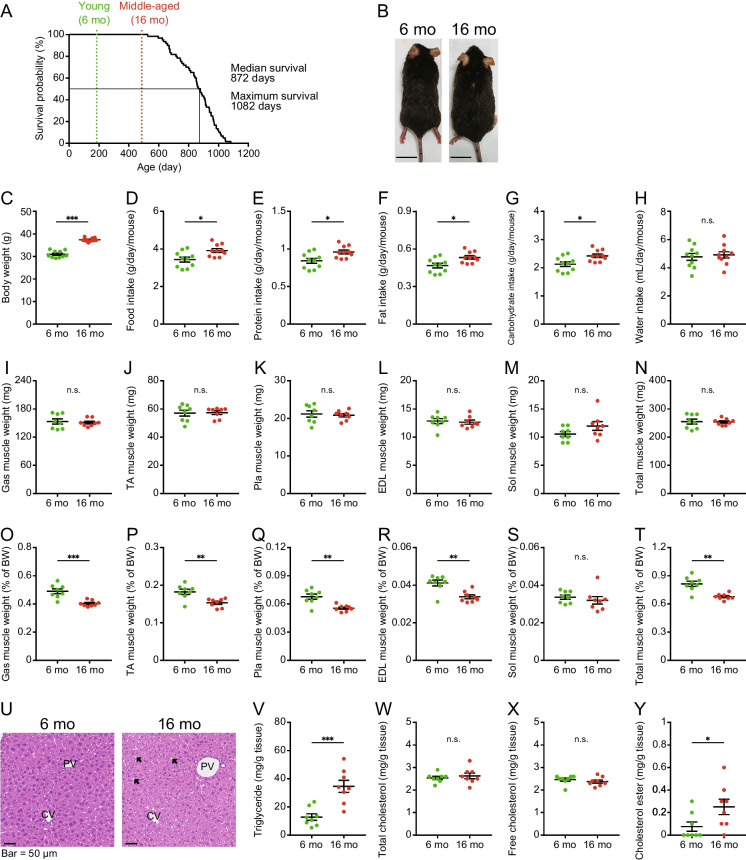
Survival curve of C57BL/6NCr male mice and physiological parameters of young and middle-aged mice. (A) Kaplan–Meier survival curves of the C57BL/6NCr male mice (n = 60) fed a CRF-1 diet (Supplemental Table 1). (B) Representative appearance of young (6 mo: 6 months of age) and middle-aged mice (16 mo: 16 months of age). (C) Bodyweight, (D) Food intake, (E) protein intake (F) fat intake, (G) carbohydrate intake, and (H) water intake, in young and middle-aged mice of cages (n = 10 per group). Weights of the (I) gastrocnemius (Gas), (J) tibialis anterior (TA), (K) plantaris (Pla), (L) extensor digitorum longus (EDL), and (M) soleus (Sol) muscles, and (N) total weight of five muscles of young and middle-aged mice (n = 8 per group). Weights normalized by bodyweight of (O) Gas muscle, (P) TA muscle, (Q) Pla muscle, and (R) EDL muscle, (S) Sol muscle, and (T) total weight of five muscles in young and middle-aged mice (n = 8 per group). (U) Representative images of hematoxylin–eosin (HE) staining in the liver section from young and middle-aged mice. PV, portal vein; CV, central vein. Where, black arrows indicate lipid droplets. (V) Content of hepatic triglycerides, (W) total cholesterols, (X) free cholesterols, and (Y) cholesterol esters in young and middle-aged mice (n = 8 per group). Data are presented as mean ± SEM and analyzed using the Welch’s t-test (C-T, V–Y). n.s., not significant. * p < 0.05, ** p < 0.01, *** p < 0.001

