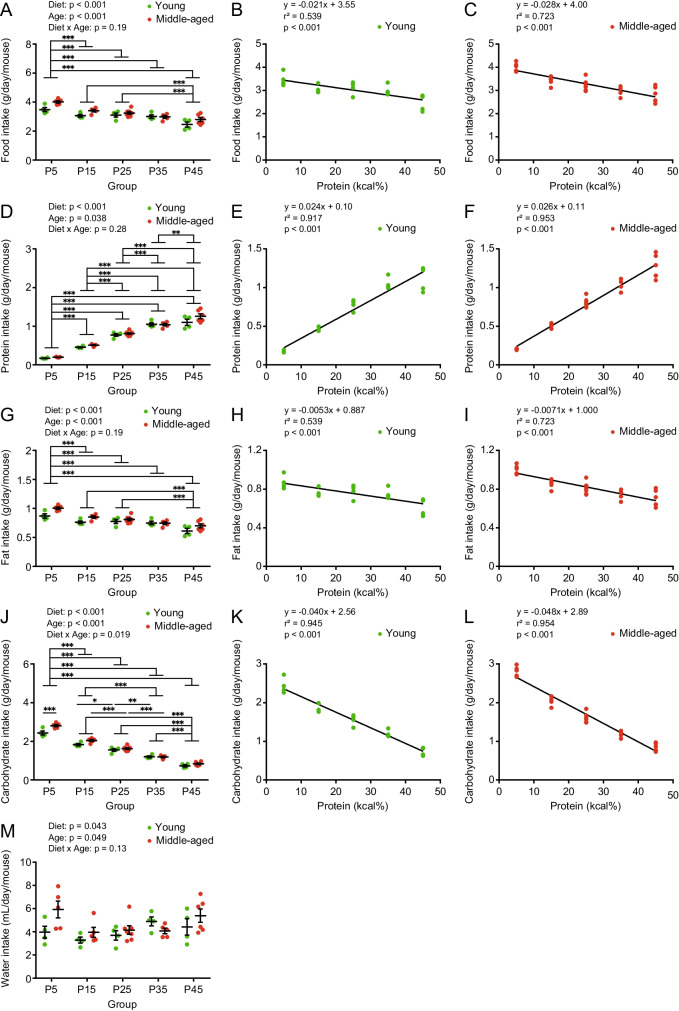
Fig. 3.
Food intake of young and middle-aged mice fed with different protein diets. (A, B, C) Food intake, (D, E, F) protein intake (G, H, I) fat intake, (J, K, L) carbohydrate intake, and (M) water intake, in young and middle-aged mice of cages (n = 4–7 per group) after 8 weeks of feeding. (B, C) Regression line of food intake, (E, F) protein intake, (H, I) fat intake, (K, L) carbohydrate intake in young and middle-aged mice of cages after 8 weeks of feeding. Data are presented as mean ± SEM and analyzed using two-way ANOVA followed by a Sidak post-test to examine the effect of age or Tukey post-test to examine the effects of diet (A, D, G, J, M). Linear regression analyses were performed to examine the association between dietary protein percentage and food (B, C), protein (E, F), fat (H, I), and carbohydrate (K, L) intake. * p < 0.05, ** p < 0.01, *** p < 0.001

