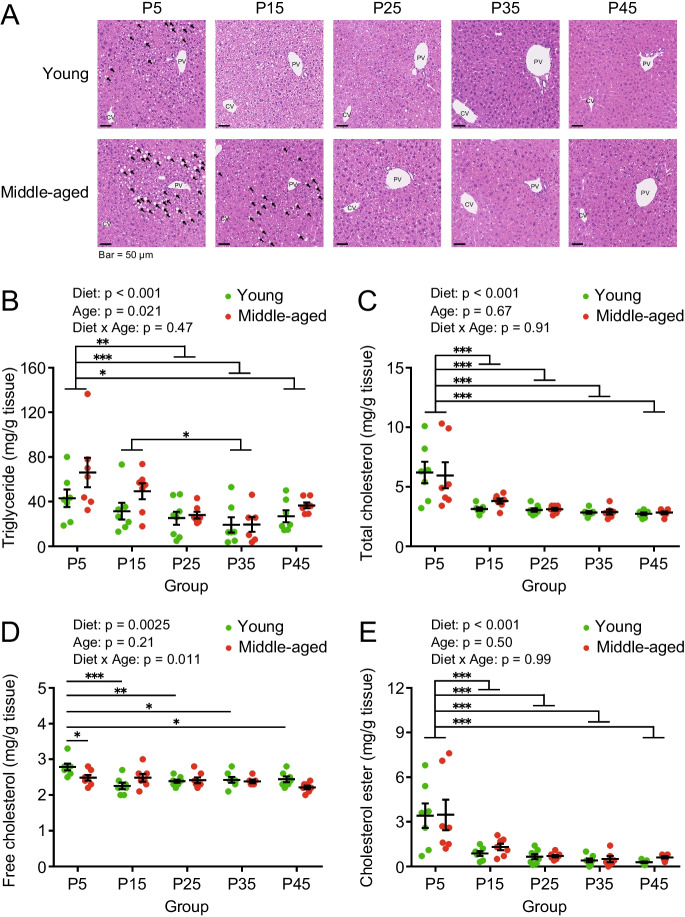
Fig. 5.
Hepatic lipid contents in young and middle-aged mice fed with different protein diets. (A) Representative images of hematoxylin–eosin (HE) staining in the liver section from young and middle-aged mice (n = 6–8 per group) fed with diets of different protein contents at 8 weeks of feeding. PV, portal vein; CV, central vein. (B) Content of hepatic triglycerides, (C) total cholesterols, (D) free cholesterols, and (E) cholesterol esters in young and middle-aged mice (n = 6–8 per group) after 8 weeks of feeding. Data are presented as mean ± SEM and analyzed using two-way ANOVA followed by a Sidak post-test to examine the effect of age or Tukey post-test to examine the effects of diet (B-E). * p < 0.05, ** p < 0.01, *** p < 0.001

