Fig. 8.
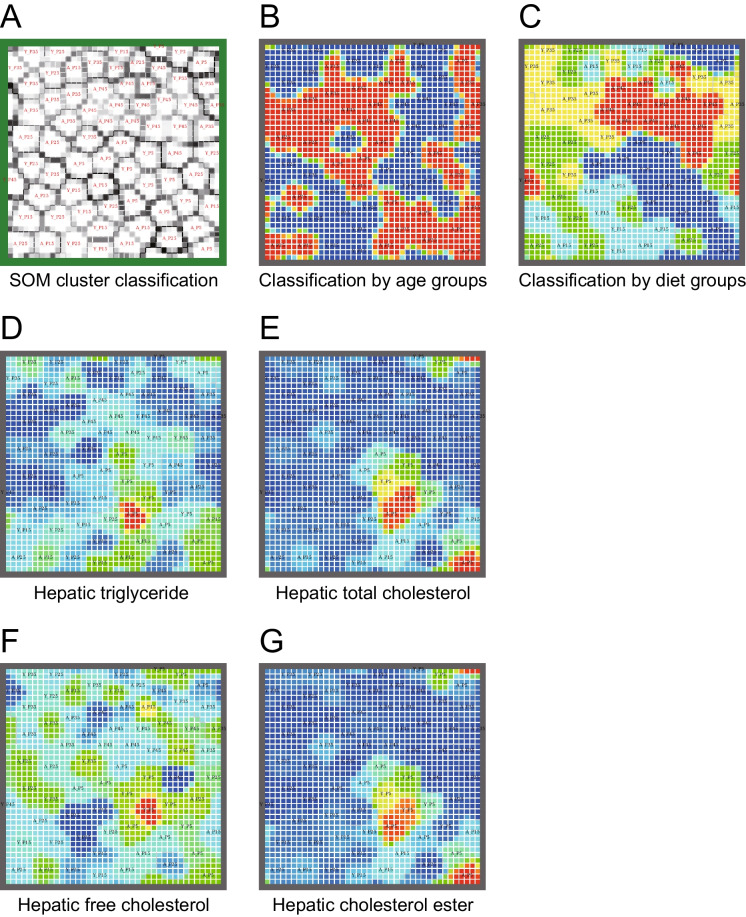
Self-organizing map (SOM) of plasma amino acid profiles classified by age and different protein diets and associated with hepatic lipid contents in young and middle-aged mice. (A) SOM cluster classification. The map was obtained using plasma amino acid concentrations of each mouse as input vectors. Similar vectors were placed near each other, forming clusters. Color and line represent the distance between neighborhood vectors (white, close: black, far). (B) Classification of groups by age (blue, young; red, middle-aged) and (C) diets (blue, P5; light blue, P15; green, P25: yellow, P35; red, P45) in the map obtained in (A). Heat map of (D) hepatic triglycerides, (E) total cholesterols, (F) free cholesterols, and (G) cholesterol esters contents overlaid on the map obtained in (A). Colors represents measured normalized values of triglycerides or cholesterols contents (red, high = 1; blue, low = 0). Data sets of plasma amino acid concentrations and hepatic lipid contents were obtained from 69 young and middle-aged mice (n = 6–7 per group) after 8 weeks of feeding

