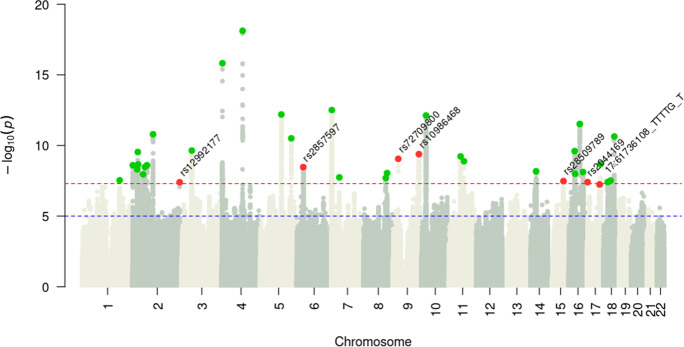
Fig. 1.
Manhattan plot of the frailty GWAS in the UK Biobank. Manhattan plot for the discovery GWAS of frailty (n = 386,565). Green dots indicate independent significant leading SNPs that have been reported to be associated with traits other than frailty; Red dots indicate independent significant leading SNPs that have never been reported before

