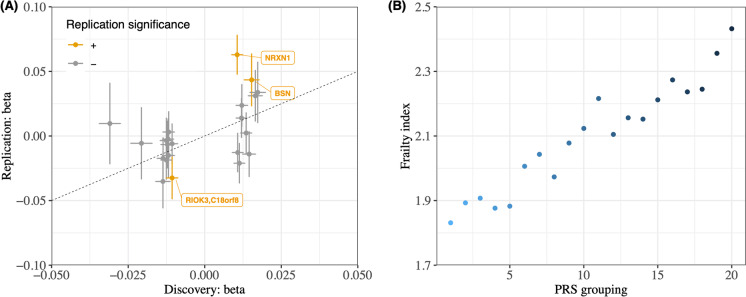
Fig. 2.
Replication in the Health and Retirement Study. (a) We plotted the effect sizes of the SNPs identified in the discovery GWAS (UKBB) against their effect sizes in the replication GWAS (HRS). The points represent significant leading SNPs identified in the UKBB. The x-axis and y-axis depict the effect sizes of the SNPs in the UKBB and HRS, respectively. The colored points indicate SNPs that retained significance in the HRS. Specifically, out of the 22 SNPs in the plot, 18 had consistent directions of effects in both studies and three remained significant in HRS. (b) We visualized the association between the frailty phenotype and the frailty PRS in HRS by plotting the mean FFS in 20 groups, which were binned according to the percentile of the frailty PRS in HRS. The PRS was generated using the UKBB data. The plot shows a significant association between the frailty PRS and the frailty phenotype in the HRS cohort, further supporting that the genetic findings from our discovery GWAS are replicable

