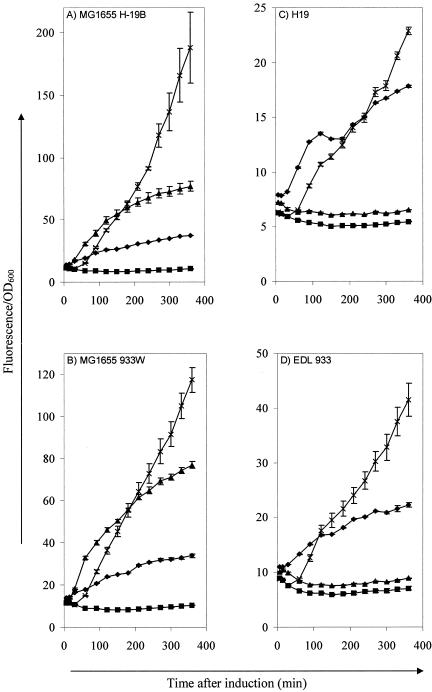
FIG. 4.
Determination of SOS promoter activity in MG1655 H-19B (A), MG1655 933W (B), H19 (O26:H11) (C), and EDL 933 (O157:H7) (D) after treatment with pressure (▴; 100 MPa, 15 min, 20°C), UV (♦; 0.2 kJ/m2), or mitomycin C (×; 0.5 μg/ml) compared to untreated cells (▪). SOS promoter activity was measured with a recA promoter transcription fusion to gfp and is expressed as fluorescence per unit of OD600. The results are expressed as means ± the standard deviations.

