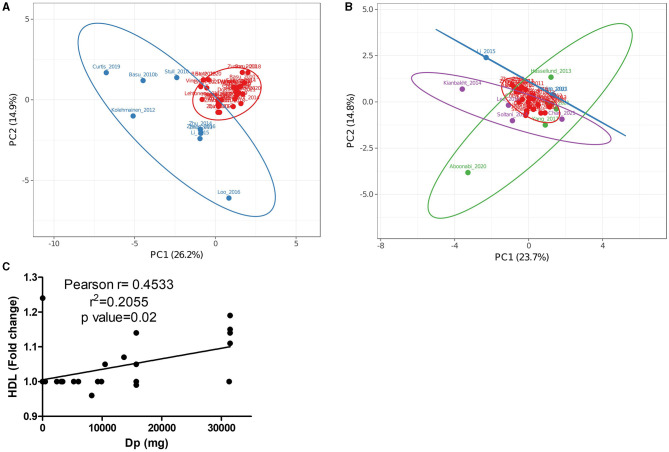
Figure 3.
Principal component analysis (PCA) of data from Figure 2 studying cohorts with pathologies including (A) or not (B) single anthocyanin doses as factors. (C) Correlation of HDL with delphinidin doses in trials included in (A, B). (A) The Red group represents trials with low variance and the blue group represents trials with high variance. (B) The red group represents trials with low variance, the blue group represents trials with high variance in (A, B), the green group represents trials with high variance that used Medox®, and the purple group represents trials with high variance that used uncharacterized or partially characterized anthocyanin sources.

