Figure 1.
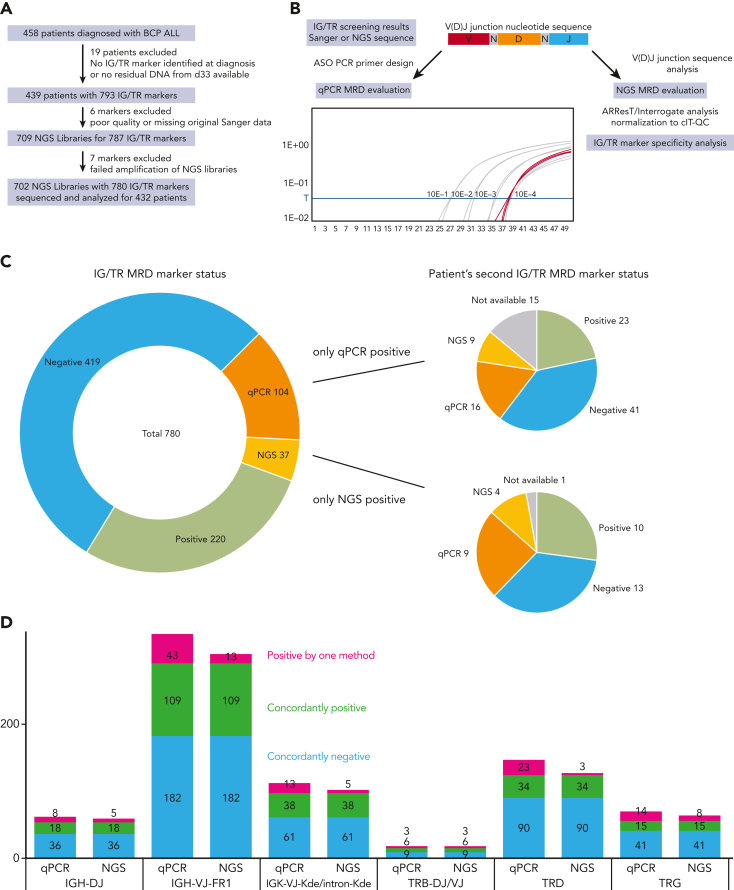
Schematic diagram of the study and classification of the MRD markers by qPCR and NGS. (A) Flow diagram of the study showing the exclusion criteria and the number of patients and samples analyzed in the study. (B) Diagram of the IG/TR MRD marker selection process and analysis from the time of diagnosis to the MRD evaluation at day 33 using both qPCR and NGS. (C) Results of IG/TR MRD marker analysis by qPCR and NGS. Markers positive only by qPCR (orange) or only by NGS (yellow) are broken down into subcategories based on the results of the second MRD marker evaluated for the same patient and marked by the same colors or gray, if the second MRD marker was not available. (D) Breakdown of all the evaluated MRD markers with their results based on the genetic locus of the IG/TR rearrangement and NGS library preparation primer mix used. Owing to a small number of samples, the IGK-VJ-Kde and intron-Kde were merged together as were TRB-DJ and TRB-VJ rearrangements. cIT-QC, central in-tube quality/quantification control; V(D)J, variable diversity joining.

