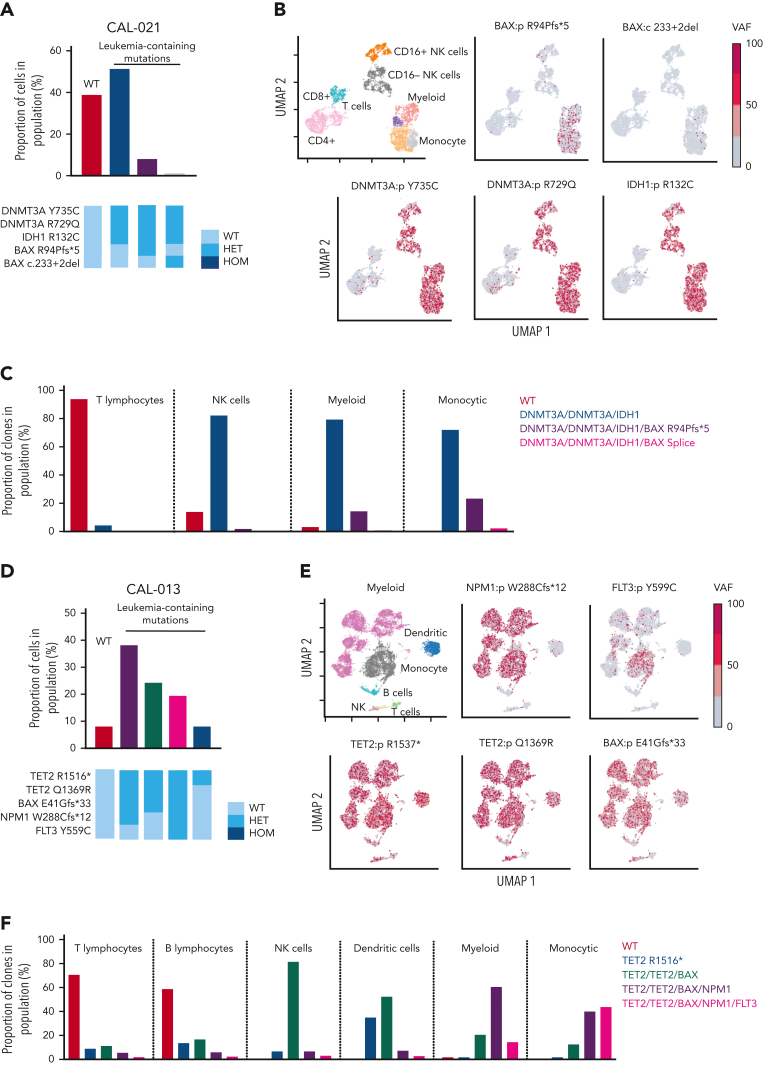
Figure 2.
BAX variants are observed in leukemic cell populations. (A) Proportion of cells in CAL-021 at relapse identified as WT or containing leukemia-associated mutations (top). Clones with leukemia-containing mutations are listed in decreasing order. Schematic of mutation zygosity for each clone (bottom). (B) Two-dimensional UMAP plot of CAL-021 at relapse showing specific phenotypic populations based on antibody tags. CAL-021 cells clustered into four main blood cell compartments including myeloid and monocytic blast populations is shown (top left). The remaining 5 UMAP plots are colored according to the genotype of each individual DNA variant. (C) Proportion of each mutant clone in CAL-021 observed at relapse within specified blood cell lineages. (D) Proportion of cells in CAL-013 after one week of venetoclax treatment identified as WT or containing leukemia-associated mutations (top). Clones with leukemia-containing mutations are listed in decreasing order. Schematic of mutation zygosity for each clone (bottom). (E) Two-dimensional UMAP plot of CAL-013 after one week of venetoclax treatment according to specific phenotypic populations identified by antibody tags. Cells clustered into six major blood cell compartments, including myeloid and monocytic blast populations (top left). The remaining five UMAP plots are colored according to the genotype of each DNA variant detected. (F) Percentages of each mutant clone observed in CAL-013 after 1 week of venetoclax treatment in specified blood cell lineages. HET, heterozygous; HOM, homozygous; NK, natural killer.

