Figure 1.
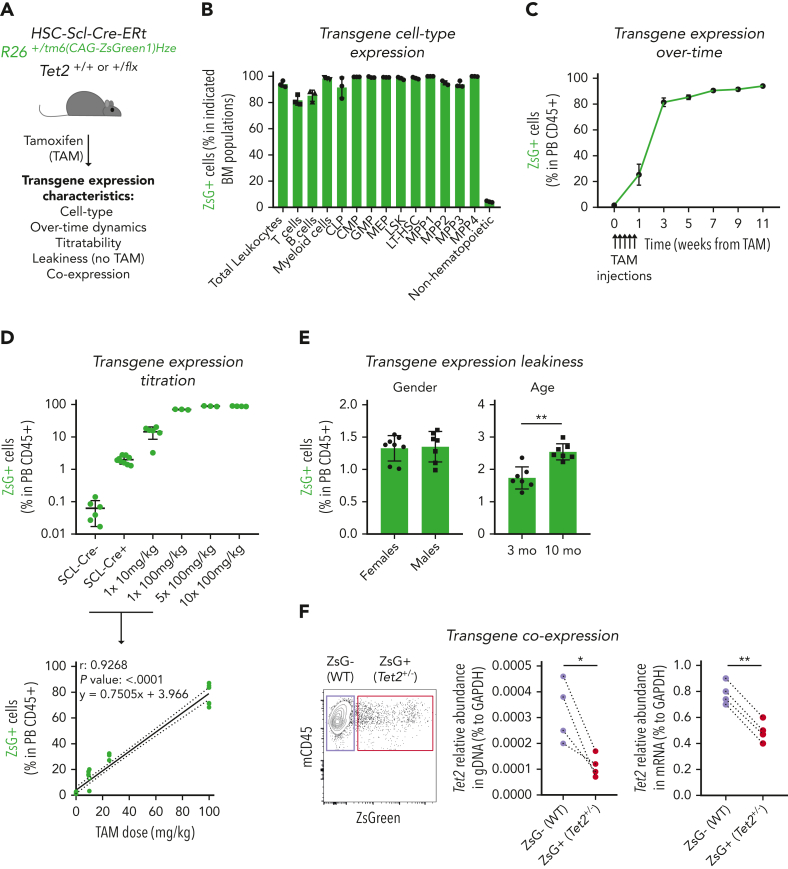
Generation of an inducible hematopoietic genetic mosaicism mouse model of Tet2+/−-driven clonal hematopoiesis. (A) Schematic representation of tamoxifen (TAM)–inducible, dose-dependent, and hematopoietic-specific genetic mosaicism mouse model of Tet2+/−-driven clonal hematopoiesis. (B) Percentage of ZsG+ cells in indicated BM populations 4 weeks after exposure to 5 consecutive TAM injections at 100 mg/kg (n = 3): common lymphoid progenitors (CLPs), common myeloid progenitors (CMPs), granulocyte-macrophage progenitors (GMPs), megakaryocyte-erythrocyte progenitors (MEPs), lineage– Sca-1+ c-Kit+ (LSK), long-term hematopoietic stem cells (LT-HSCs), multipotent progenitors 1 to 4 (MPP1-4), and nonhematopoietic cells. (C) Longitudinal quantification of the percentage of ZsG+ in peripheral blood (PB) CD45+ cells after exposure to 5 consecutive TAM injections at 100 mg/kg (n = 3). (D) Percentage of ZsG+ in PB CD45+ cells 4 weeks after exposure to indicated TAM doses (n = 3) (top). Correlation between the percentage of PB ZsG+ CD45+ cells and the amount of TAM injected. Pearson correlation coefficient (r), P value, and linear equation are indicated (n = 29) (bottom). (E) Percentage of ZsG+ CD45+ cells in the absence of TAM injection (n = 7-8), in female or male adult mice (left); in 3-month-old (3 mo) or 10-month-old (10 mo) mice (right). (F) Representative dot plot of ZsG– wild type (WT; purple box) and ZsG+Tet2+/− (red box) (left). Quantification of Tet2 gene abundance in genomic DNA (gDNA) from ZsG– (WT) and ZsG+ (Tet2+/−) CD45+ cells (n = 4) (right). Quantification of Tet2 gene abundance in complementary DNA from ZsG– (WT) and ZsG+ (Tet2+/−) CD45+ cells (n = 4). ∗P < .05, ∗∗P < .01 by unpaired (E) and paired (F) t-test. Error bars represent standard error of the mean. GAPDH, glyceraldehyde-3-phosphate dehydrogenase.

