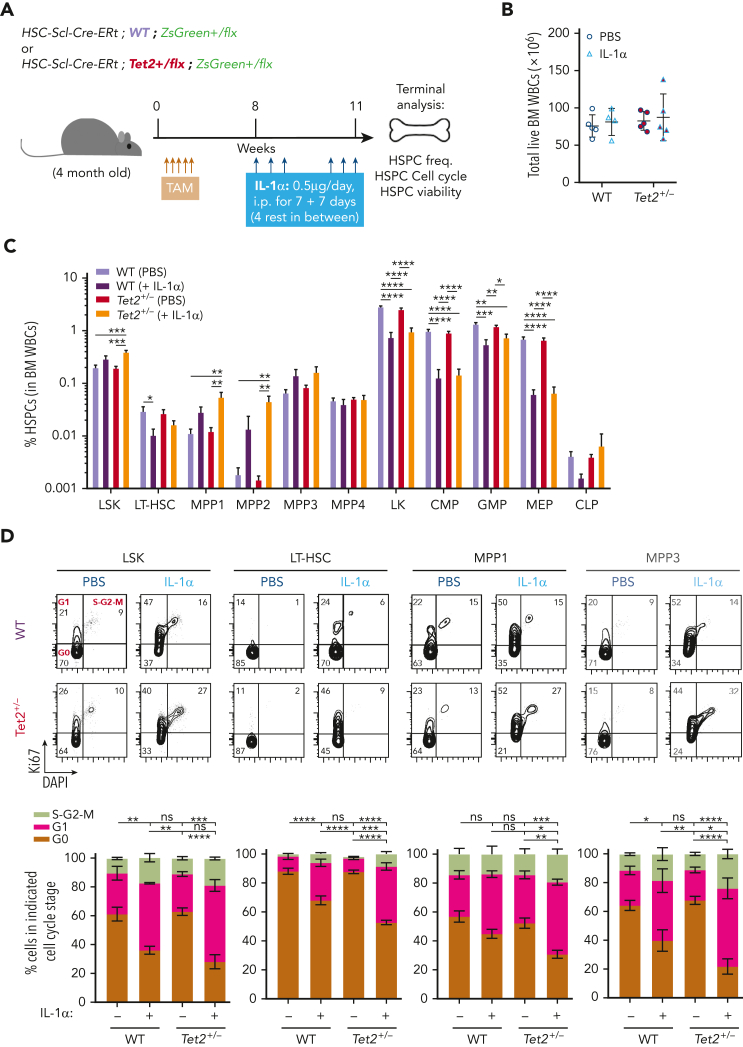
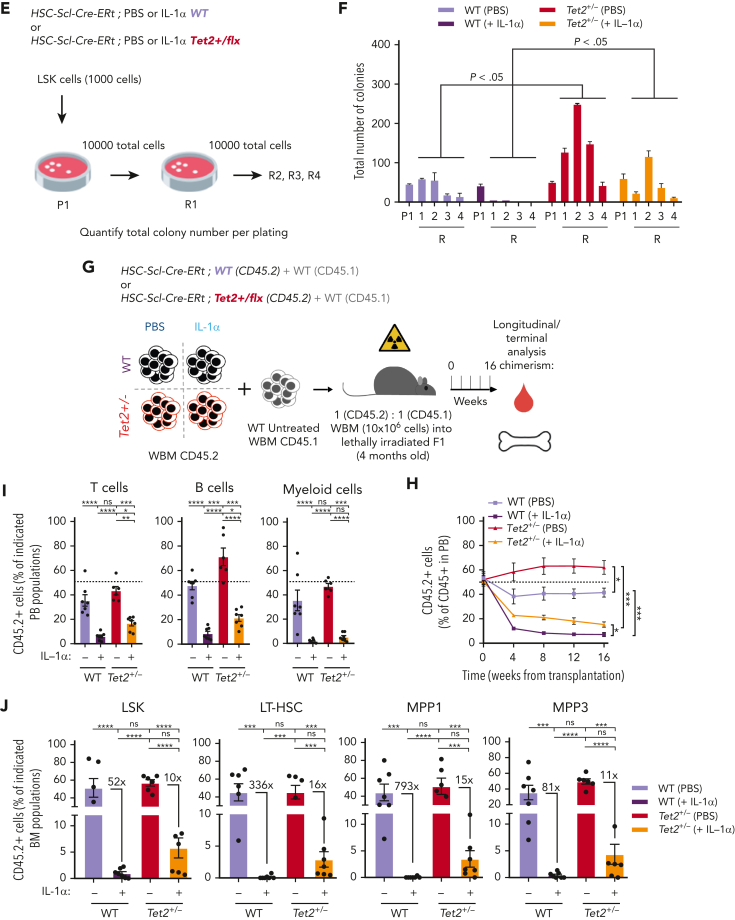
Figure 4.
Tet2+/− HSPCs maintain higher proliferative and repopulation capacity than WT in response to long-term IL-1α. (A) Experimental design. (B) Number of total white blood cells in BM (2 femurs and 2 tibias) of WT and Tet2+/− mice exposed to PBS or IL-1α (n = 4-5). (C) Percentage of indicated BM populations in WT and Tet2+/− mice exposed to PBS or IL-1α (n = 4-5). (D) Representative fluorescence-activated cell sorting plot of cell cycle analysis of indicated populations; percentage per quadrant is indicated. Percentage of indicated BM populations in G0, G1, or S-G2-M phases of cell cycle from WT and Tet2+/− mice exposed to PBS or IL-1α (n = 4-5). Statistical analysis performed for G0 stage. (E) Experimental design. (F) Quantification of total colony numbers after plating (P)/replating (R) of WT and Tet2+/− LSK/total cells in methylcellulose after initial exposure to PBS or IL-1α (n = 3). (G) Experimental design. (H) Longitudinal quantification of percentage of donor-derived PB CD45.2+ WT and CD45.2+Tet2+/− from mice exposed to PBS or IL-1α in a 50:50 BM competition in vivo setting with untreated CD45.1 WT BM cells (n = 6-7). (I) Percentage of CD45.2+ cells in indicated PB and BM (J) populations from in WT and Tet2+/− mice exposed to PBS or IL-1α (n = 6-7). (J) Depicted in the graphs are the fold variation values between indicated means. Data are a pool of at least 2 independent experiments. ∗P < .05, ∗∗P < .01, ∗∗∗P < .001, and ∗∗∗∗P < .0001 by a 1-way analysis of variation with Tukey correction. Error bars represent standard error of the mean. ns, not significant; WBM, whole bone marrow.


