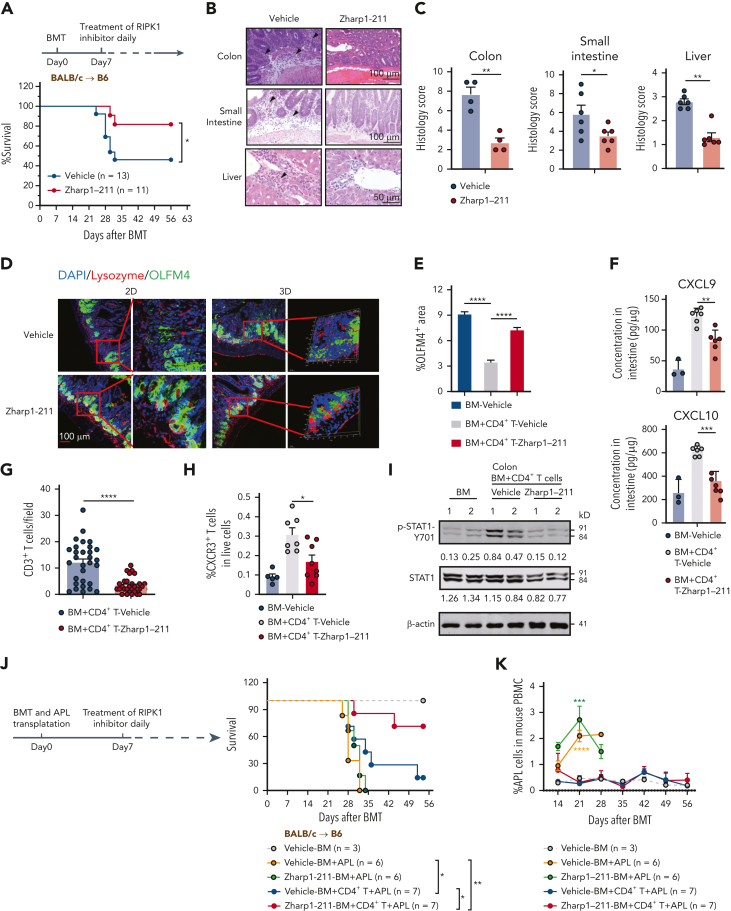
Figure 7.
Pharmacological inhibition of RIPK1 reduces ongoing GVHD while preserving GVL activity. (A-I) The lethally irradiated B6 recipients (BALB/c→B6) received BALB/c TCD BM cells with CD4+ T cells. Starting at 7 days after allo-HCT, mice were treated daily (intraperitoneally) with vehicle or Zharp1-211 (5 mg/kg). (A) Survival of mice after allo-HCT. (B-C) Histological analysis of small intestine and liver, assessed on day 17 after allo-HCT. Representative H&E images (B) and quantification of pathology scores (C). Bars in colon and small intestine represent 100 μm. Bar in liver represents 50 μm. Black arrows indicate areas of inflammatory cell infiltration or cell damage. (D) Representative 2D and 3D confocal images of OLFM4+ ISCs and lysozyme+ Paneth cells in small intestines from the indicated mice at 17 days after allo-HCT. Bar represents 100 μm. (E) Quantitation of IHC staining of OLFM4 in small intestines on day 17 after allo-HCT. (F) ELISA analysis of CXCL9 and CXCL10 protein levels in the small intestine from the indicated mice at 17 days after allo-HCT. (G) Quantification of infiltrated CD3+ T cells in the small intestines from the indicated B6 recipients at day 17 after allo-HCT. (H) Quantification of infiltrated CXCR3+ CD3+ T cells in the small intestine from the indicated B6 recipients at day 17 after allo-HCT. (I) Immunoblotting analysis of p-STAT1, STAT1, and β-actin in the intestine from the indicated B6 recipients after allo-HCT. Quantification of p-STAT1 or STAT1 normalized to β-actin was shown under the band. (J-K) The lethally irradiated B6 recipients received TCD BM cells (BM) alone, or in combination with CD4+ T cells from BALB/c mice. Subsequently, these mice were challenged with 1 × 10⁶ APL at the time of the BM transplant. Starting at 7 days after allo-HCT, recipients were treated daily (intraperitoneally) with vehicle or Zharp1-211 (5 mg/kg). The survival rates (J) and percentage of APL cells in peripheral blood from day 14(K) were measured. Vehicle-BM+APL group and Zharp1-211-BM+APL group were compared with Vehicle-BM group on day 21. Data shown are representative of 2 or 3s independent experiments. Data are shown as the mean ± SD (E), histology scores and concentrations of cytokines are shown as the mean ± SEM (C,F-H,K). ∗P < .05; ∗∗P < .01; ∗∗∗P < .001; ∗∗∗∗P < .0001. Survival comparisons were evaluated by log-rank test (A,J). Multiple comparisons were evaluated by one-way ANOVA (E-F,H); two-group comparisons used unpaired t tests (two-tailed) (C,G); APL cell measurements were evaluated by two-way ANOVA (K). ANOVA, analysis of variance; ELISA, enzyme-linked immunosorbent assay analysis; IHC, immunohistochemistry; SD, standard deviation; SEM, standard error of the mean.

