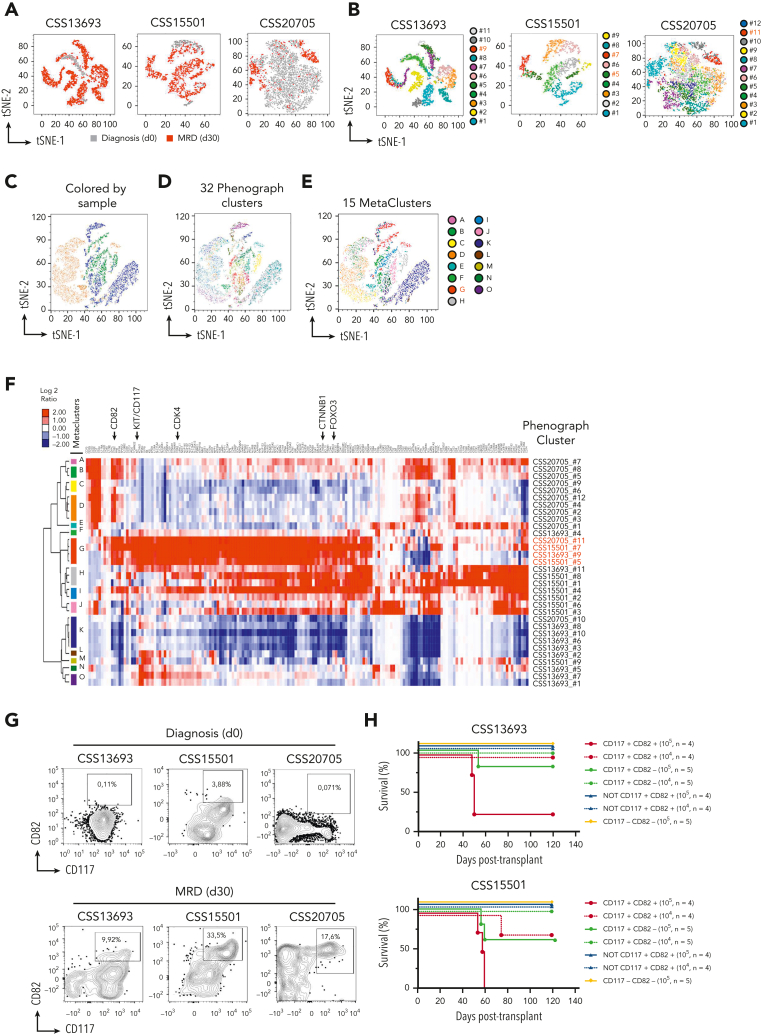
Figure 4.
Coexpression of β-catenin, FOXO3, and CDK4 identify LIC-enriched CD117+CD82+cell subsets in MRD of human T-ALLs. (A) T-distributed stochastic neighbor embedding (tSNE) plots based on the scRNA-seq and AbSeq data from 3 primary T-ALL samples; CSS13693, CSS15501, and CSS20705, at the time of diagnosis (day 0) and 30 days after the start of therapy (MRD day 30) without passaging into immunocompromised mice. In the map, leukemia cells at days 0 and 30 are colored in grey and red, respectively. (B) tSNE plot as in panel A, but with each Phenograph cluster depicted in a different color. There was a total of 32 different phenotypic clusters identified by the Phenograph algorithm. The clusters with the highest expression of FOXO3, CTNNB1, and CDK4 transcripts are indicated in red. Dimensional reduction tSNE plots of scRNA-seq data with cells colored according to their assigned sample (C) or Phenograph cluster (D). (E) tSNE plot as in panel C, but with cells colored by their assigned meta-cluster (MC). The MC with the highest expression of FOXO3, CTNNB1, and CDK4 transcripts is indicated in red. (F) Expression heat map and hierarchical clustering of selected surface markers (GO:0016021) together with FOXO3, CTNNB1, and CDK4 genes, which resulted heterogeneously transcriptionally expressed in each of the 32 Phenograph clusters and hierarchically clustered into 15 MC groups. (G) Flow cytometry plots of CSS13693, CSS15501, and CSS20705 samples at the time of diagnosis (day 0) and MRD (day 30), showing the protein expression of CD117 and CD82 cell markers. Tumor cells were gated based on the expression of CD3, CD99, and CD7 surface markers and identified as CD3−CD99+CD7+ cells. (H) Survival of recipient NSG mice after transplantation with FACS-sorted CD117+CD82+, CD117+CD82−, CD117−CD82− or double negative plus single positive (NOT CD117+CD82+) subsets from CSS13693 and CSS15501 primary samples of MRD at day 30. The cell doses for each recipient animal are indicated in brackets. The calculated LIC frequency in CD117+CD82+ cells is 1 in 25 978 (95% CI, 1 in 7616-88 604) and 1 in 87 326 (95% CI, 1 in 27 516-277 145), in CD117+CD82− cells is 1 in 221 246 (95% CI, 1 in 55 495-882 056) and 1 in 498 332 (95% CI, 1 in 70 566-3 519 195) for CSS15501 and CSS13693 samples, respectively, and in NOT CD117+CD82+ and CD117−CD82− cells is >1 in 146 876 (95% CI, 1 in 66 888-3 277 606) for both leukemias.

