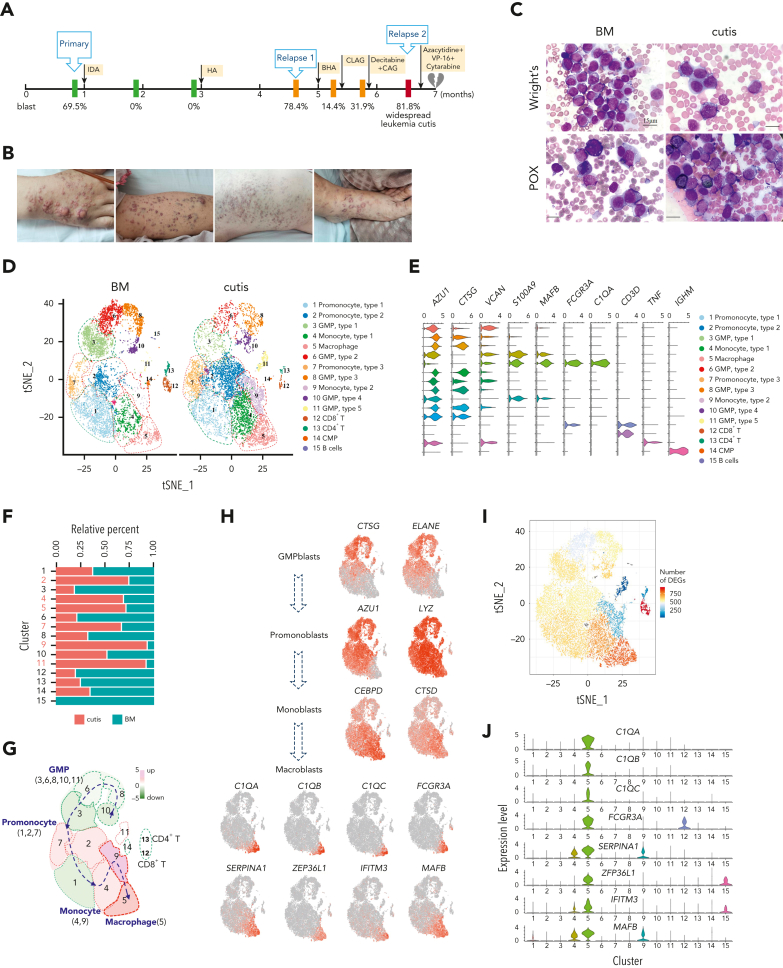
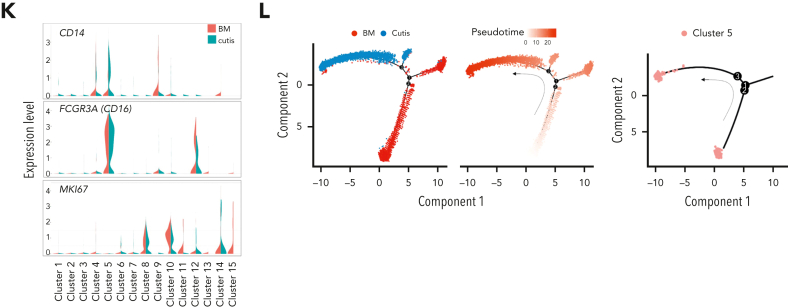
Figure 1.
scRNA-seq identified unique C1Q+ macrophage-like leukemia cells in a patient with AML (P-S1022). (A) Disease course of P-S1022 from primary to deceased. (B) Clinical presentations of leukemia cutis. (C) Wright staining and peroxidase staining of BM biopsy collected at relapse 1 and cutis sample of P-S1022. (D) Unsupervised t-distributed stochastic neighbor embedding (t-SNE) plot displaying 18 213 cells from BM and cutis samples of P-S1022. Number- and color-labeled 15 different clusters. Clusters belonging to the same category of cells were distinguished by type 1, 2, or 3. (E) Expression levels (x-axis) of cluster-defining genes in each cluster. Violin plots show the distribution of normalized expression levels of genes and are color coded according to cluster, as in panel D. (F) Frequencies of defined clusters, color coded based on origin (BM vs cutis). Red bar indicates cutis-derived cells; green bar, BM-derived cells. (G) Differentiation trajectory of 15 identified clusters. Arrow begins from the primitive clusters to mature clusters. Red indicates increase and green indicates decrease of frequencies of defined clusters (cutis vs BM). (H) t-SNE projections of selected marker genes of indicated clusters are shown (left). (I) Projection of differentially expressed genes (DEGs) between BM and cutis sample on t-SNE plot. DEGs: |log fold change| >0.5; adjusted P < .05 was derived by a Wilcoxon rank-sum test. (J) Expression levels (y-axis) of featured genes in 15 clusters. Violin plots show the distribution of normalized expression levels of indicated genes. (K) Expression levels of monocyte- (CD14 and FCGR3A/CD16) and proliferation-associated (MKI67) genes are illustrated by violin plots. (L) Trajectory of leukemia cells of BM and cutis samples using the monocle 2 algorithm and pseudotime projections for the distinct transcriptional states, with each point representing a single cell. Three states (1, 2, and 3) are identified. Solid arrows represent cell trajectories defined by single-cell transcriptomes. BHA, bortezomib + homoharringtonine + cytarabine; CAG, cytarabine + granulocyte colony-stimulating factor (G-CSF); CLAG, cladribine + cytarabine + G-CSF; CMP, common myeloid progenitor; GMP, granulocyte-monocyte progenitors; HA, homoharringtonine + cytarabine; IDA, idarubicin + cytarabine.


