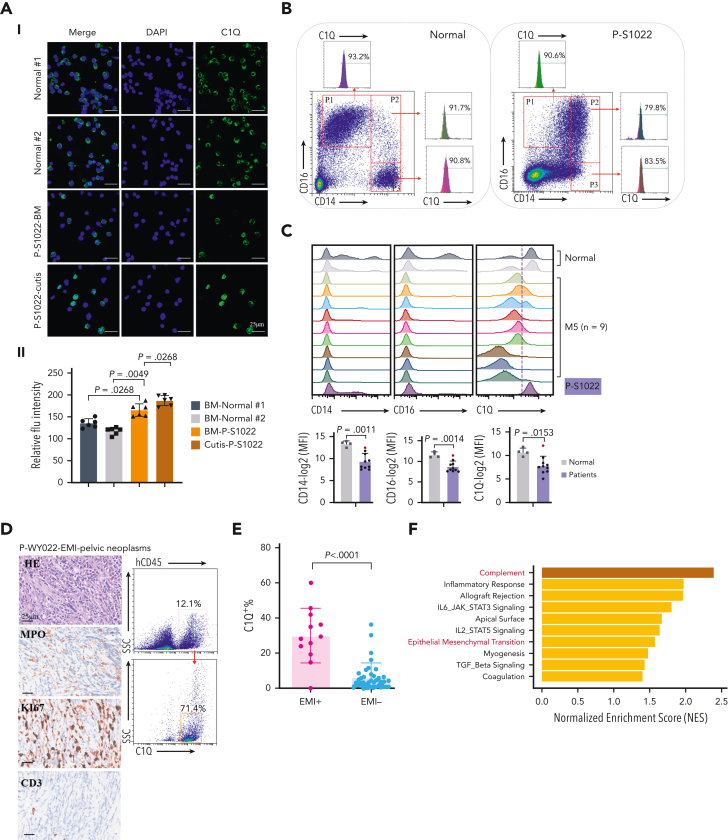
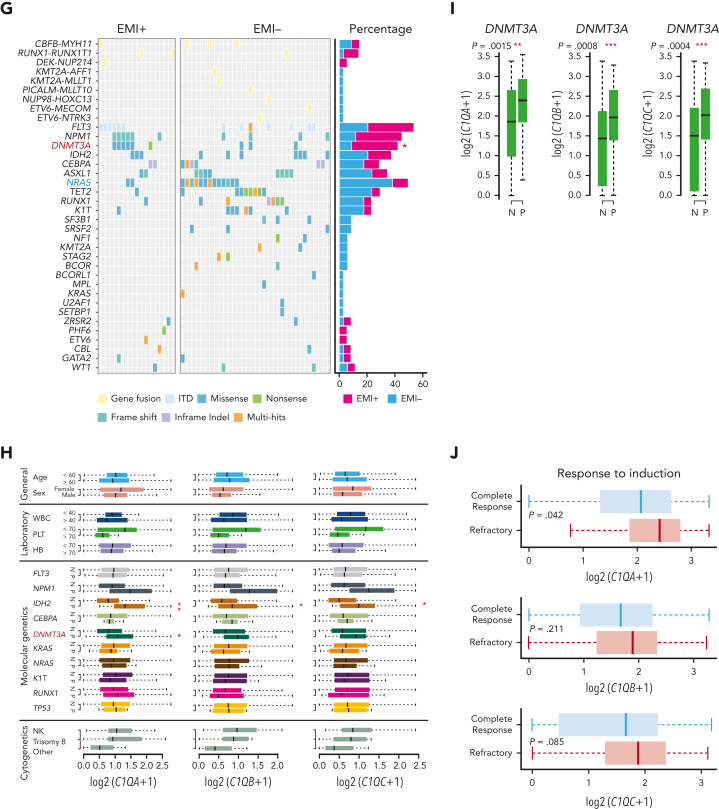
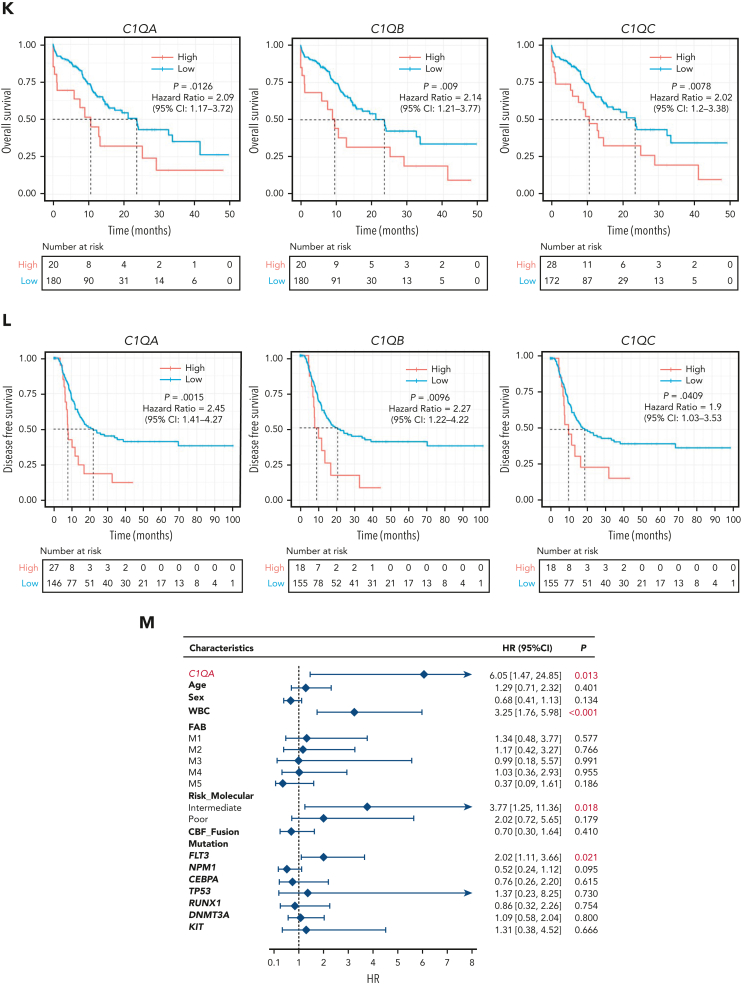
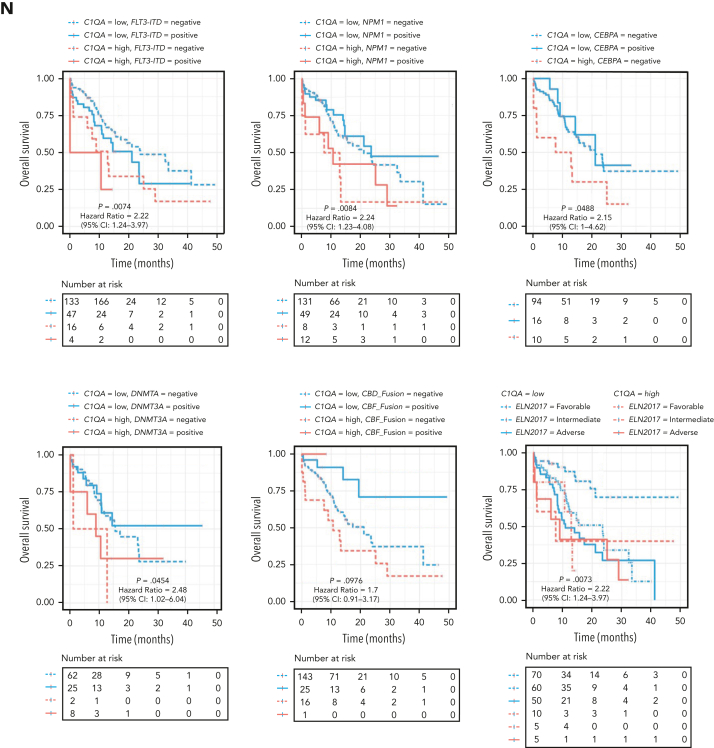
Figure 2.
C1Q+ macroblasts exist in patients with AML and predict poor outcomes. (A) Immunofluorescent staining of C1Q in BM from healthy donors (normal #1 and normal #2) and BM and cutis samples from P-S1022 are shown in panel Ai. Quantified fluorescence intensities were shown in panel Aii (bottom). (B) Flow cytometry analysis of CD14, CD16, and C1Q on BM samples of healthy donor (normal) and P-S1022. P1 gate, nonclassical monocyte subset (CD14lowCD16high); P2 gate, intermediate monocyte subset (CD14highCD16high); and P3 gate, classical monocyte subset (CD14highCD16low). (C) Expression of CD14, CD16, and C1Q evaluated by flow cytometry in BM from healthy donors, P-S1022, and other patients with AML-M5 (n = 9). Mean fluorescence intensity was quantified by flow cytometry and is shown (bottom). The red dot indicates P-S1022. (D) The leukemic invasions in pelvic tissue from P-WY022 were analyzed by hematoxylin and eosin (H&E) staining and immunohistochemistry (IHC) staining of MPO, KI67, and CD3. Flow cytometry analysis of human CD45 (hCD45) and C1Q expression on cells is shown (right). (E) Expression of C1Q was evaluated by flow cytometry in BM from patients with AML with (EMI+) or without (EMI−) EMI. (F) Top 10 HALLMARK gene sets from the gene set enrichment analysis between patients with AML with or without EMI. (G) Landscape and percentage for the mutations and fusions in patients with AML with or without EMI. ∗P = .0314. (H) Differential expression of C1QA, C1QB, and C1QC by general (age and sex), laboratory (white blood cell counts, platelets, and hemoglobin), cytogenetic, and molecular genetics characteristics in patients with AML from our inhouse RNA-seq data set (n = 110). P values are shown from 2-sample 1-tailed t test. ∗P < .05, ∗∗P < .01. (I) Differential expression of C1QA, C1QB, and C1QC by the DNMT3A mutation in patients with AML from the BeatAML data set. P values are shown from 2-sample 1-tailed t test. ∗∗P < .01, ∗∗∗P < .001. (J) Differential expression of C1QA, C1QB, and C1QC for the induction response in patients with AML from the BeatAML data set. P values are shown from 2-sample 1-tailed t test. (K) Differences in OS in patients with de novo AML from the BeatAML data set (n = 200) by expression of C1QA, C1QB, and C1QC. P values, hazard ratios (HRs), and 95% confidence interval (CI) are shown from univariate Cox analysis. (L) Differences in DFS in patients with de novo AML from the TCGA data set (n = 173) by expression of C1QA, C1QB, and C1QC. P values, HRs, and 95% CI are shown from univariate Cox analysis. (M) Multivariate Cox analysis of DFS in patients with de novo AML from the TCGA data set (n = 173) according to C1QA expression, age, sex, white blood cell counts, French-American-British classification, risk molecular, CBF fusion, and genetic characteristics. Patient number and percentage, regression coefficient (β), HR, and P values are shown for each parameter. (N) Differences in OS in patients with de novo AML from the BeatAML data set (n = 200) by combination of C1QA expression with presence of FLT3-ITD, NPM1, CEBPA, DNMT3A, and CBF fusion, or 2017 European LeukemiaNet risk stratification. P values, HRs, and 95% CI are shown for C1QA high expression from the multivariate Cox analysis. CBF fusion: RUNX1-RUNX1T1 fusion or CBFB-MYH11 fusion.


