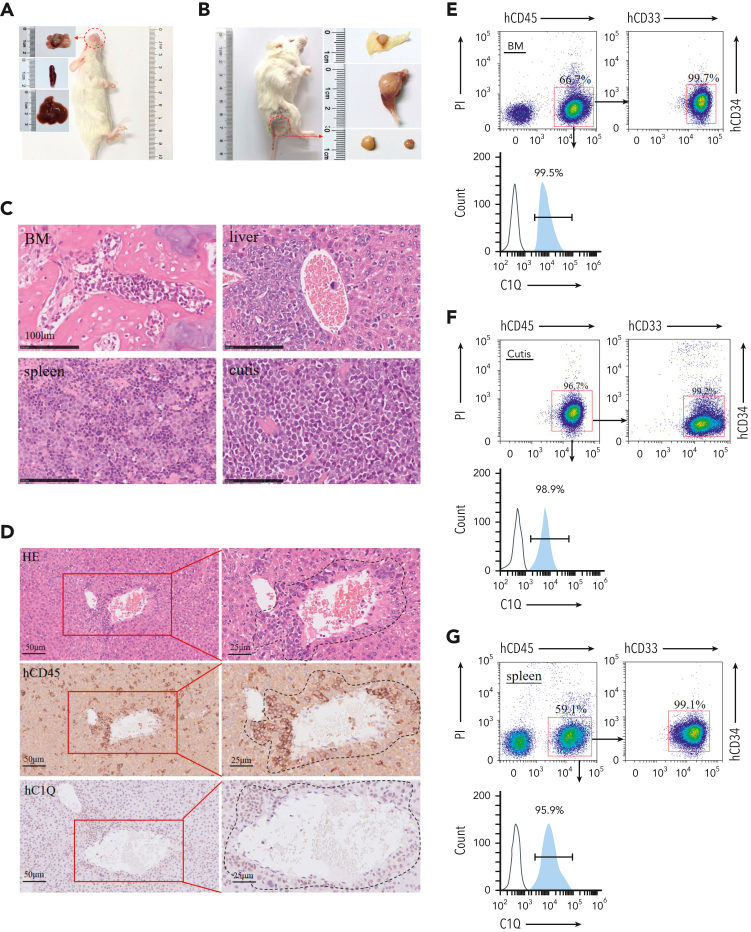
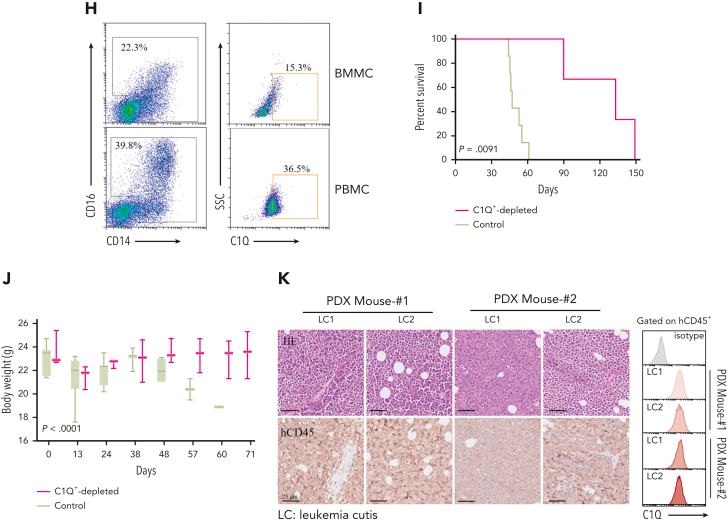
Figure 4.
C1Q+populations are cancer-initiating cells. (A-B) Pictures of PDX recipient-mice constructed by injecting 1 million primary cells of P-S1022. Red circles and arrows indicate the leukemia cutis. (C-D) The leukemic invasions in BM, spleen, liver, and cutis were analyzed by H&E staining (C-D), or IHC staining of hCD45 and hC1Q in liver (D). Flow cytometry analysis of human CD45, CD33, CD34, and C1Q (hCD45, hCD33, hCD34, and hC1Q) expression on cells recovered from BM (E), cutis (F), or spleen (G) of PDX recipient mice. (H) Flow cytometry sorting of BM and peripheral blood sample of P-S1022 based on expression of C1Q. (I-J) Survival curve and body weight of PDX mice injected with one million cells sorted from P-S1022. The hCD45+ cells of P-S1022 were sorted to deplete C1Q+ cells and injected into NSG mice through tail vein. P value was calculated by log-rank (Mantel-Cox) test (I) and 2-sample t test (J). (K) The leukemia cutis from PDX mice was analyzed by H&E and IHC staining of hCD45. Flow cytometry analysis of C1Q expression on cells is shown (right).


