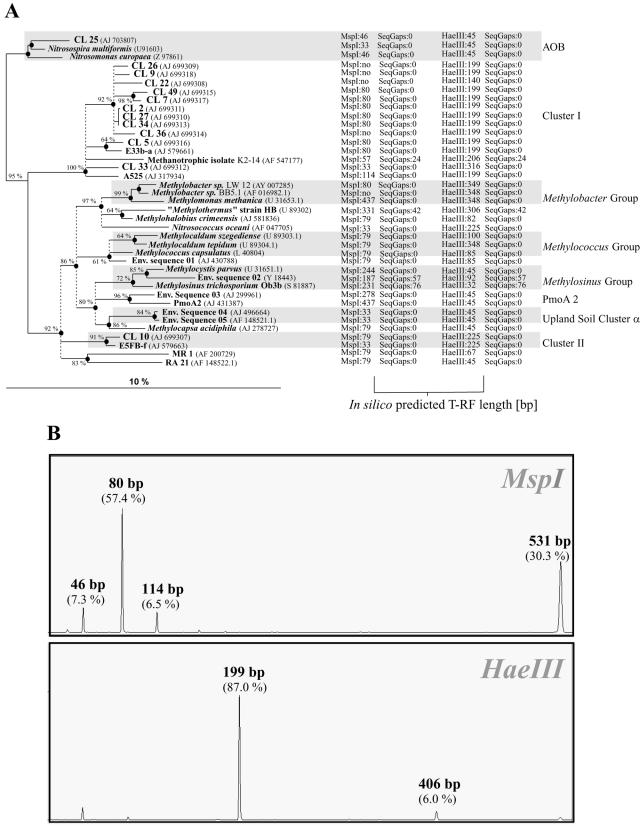
FIG. 1.
(A) Phylogeny of pmoA sequences and corresponding T-RFs predicted by in silico analysis through TRF-CUT. The tree is slightly modified from the ARB display. The tree was calculated from 127 deduced amino acid positions by the tree puzzle, maximum-likelihood, and neighbor-joining methods. Ten thousand puzzling steps were performed, and probability estimates (≥60%) are given as percentages at nodes. Accession numbers are in parentheses. Thickened nodes were common to both maximum-likelihood and neighbor-joining analyses. Dashed vertical lines (polytomies) indicate unresolved branching, which was inferred from conflicting results of the phylogenetic analyses and low (≤60%) tree puzzle support values. The scale bar indicates 10% sequence divergence. T-RF lengths after MspI and HaeIII in silico hydrolysis are given by numbers following the enzyme names; no, no restriction site within the analyzed pmoA fragment; SeqGaps 0, no gap; another number following SeqGaps indicates the size of the gap between the priming site and the start of the actual sequence. (B) T-RFs retrieved from a pH-neutral temperate forest soil by T-RFLP with MspI and HaeIII. Lengths of T-RFs represented by pmoA clones are indicated. Values in parentheses are the relative contributions of the T-RFs to the total sample fluorescence. x axis, size of T-RFs in base pairs; y axis, relative fluorescence units.

