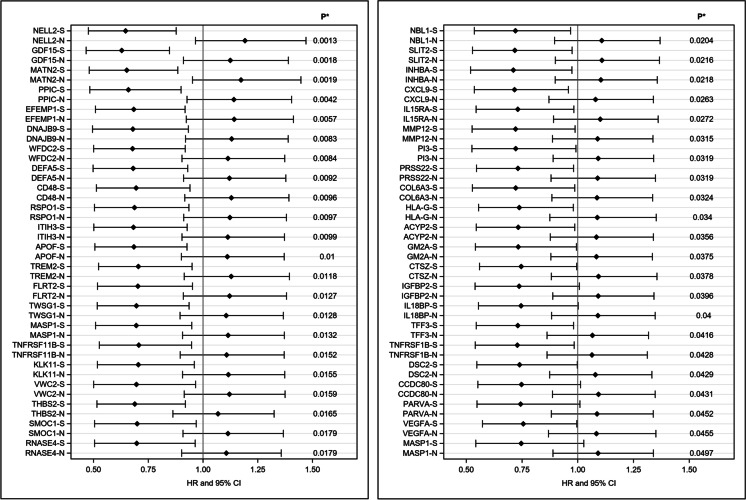
Fig. 1.
Forest plots of hazard ratios of contrasting FOXO3 genotypes and mortality in stressed (S) and non-stressed (N) subjects for top 44 proteins that increase with aging. *p value for comparison of hazard ratios of FOXO3 genotype (FOXO3 rs12212067) G allele carriers (TG/GG) vs. major allele homozygote (TT) with mortality in stressed and non-stressed subjects. “Stressed” refers to those subjects with upper tertile of mortality-associated proteins. Note: MASP1 (last entry in Table) is represented twice because two separate aptamers were identified

