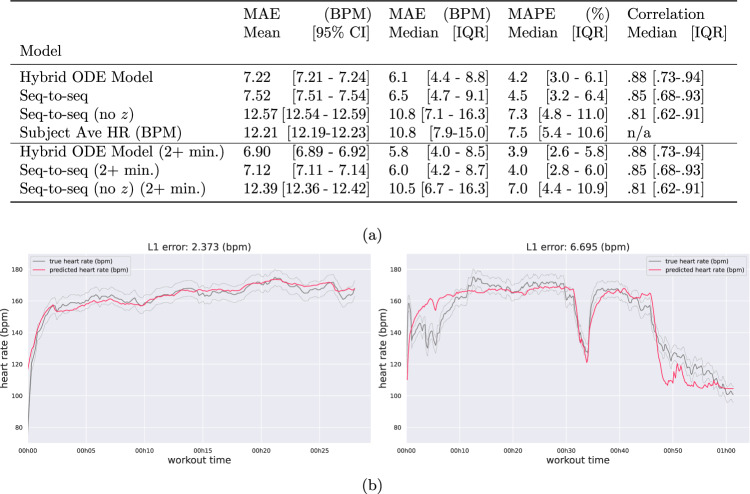
Fig. 3. Prediction performance summary.
a Heart rate reconstruction performance. We compare the average workout mean absolute error (MAE) (and 95 % CI), as well as the median workout MAE and interquartile range (IQR). Additionally, we compare the mean absolute percent error (MAPE) (and IQR) and the prediction sequence correlation (and IQR). We observe the history embedding z used in the hybrid ODE model and seq-to-seq baseline improves predictions, and the hybrid ODE model consistently outperforms the strong seq-to-seq baseline. b Example HR predictions for two separate workouts. The x-axis indicates time since the beginning of the workout and the y-axis shows the subject’s instantaneous heart rate (beats per minute). The measured heart rate sequence is in gray, and the predicted sequence is in red. Uncertainty bands about the observation reflect a standard deviation of ± 5 beats per minute in the heart rate measurement. Additional predictions in Supplemental Fig. 7.

