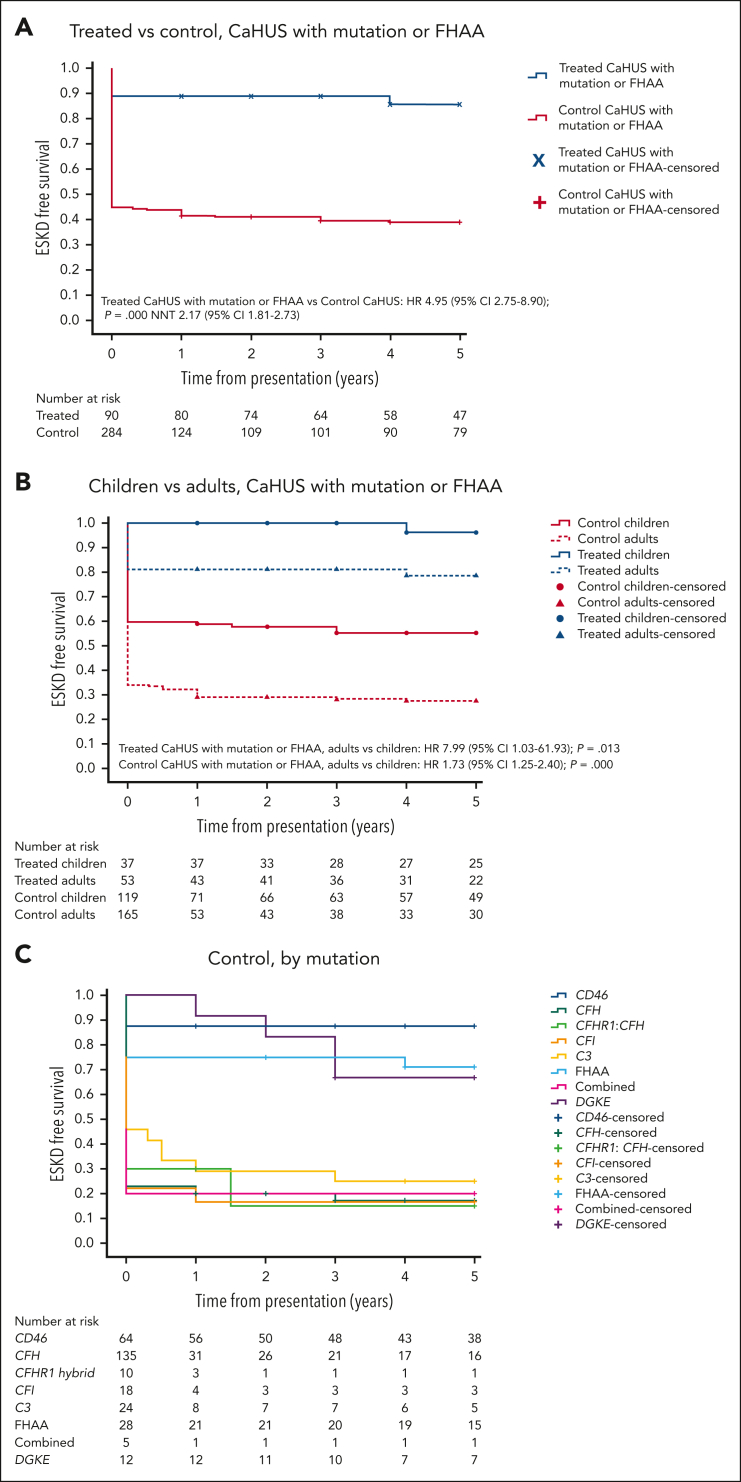
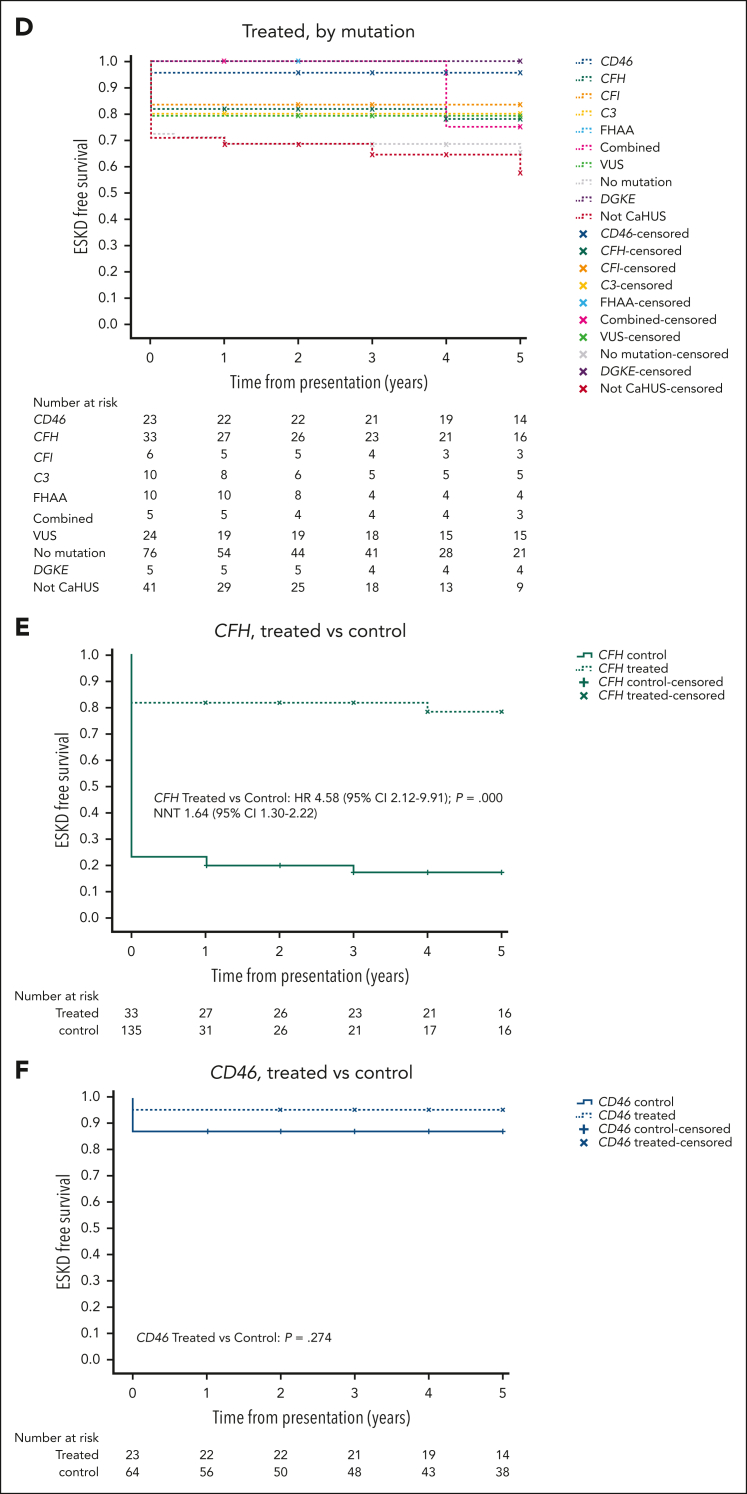
Figure 2.
Five-year cumulative estimates (Kaplan-Meier) of end-stage kidney disease–free survival. HRs and 95% CIs calculated using the Cox proportional hazard regression model, P values calculated using the log-rank test, and the NNT are shown where appropriate. (A) Treated vs control, CaHUS with mutation or FHAA. (B) Children vs adults, CaHUS with mutation or FHAA. (C) Control group based on the mutation type. (D) Treated group, based on the mutation type. (E) Treated vs control, individuals with CFH mutation subgroup. (F) Treated vs control, individuals with CD46 mutation subgroup.


