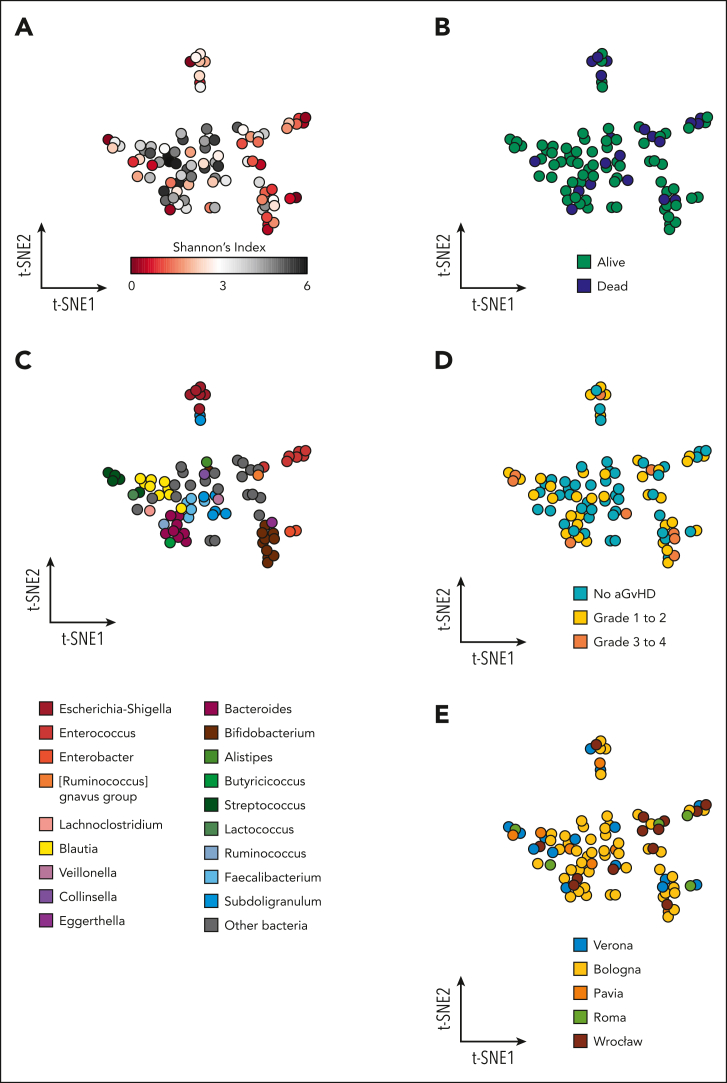
Figure 3.
Pretransplant GM and outcomes in pediatric patients undergoing allo-HSCT. The GM composition at the genus level of the 90 patients before transplantation is represented according to the t-SNE algorithm. Each point represents a stool sample from a single patient, and the axes (t-SNE1 and t-SNE2) have arbitrary units. The more similar the samples are in microbiota composition, the closer they appear on the t-SNE plot. Higher-diversity samples (A) congregate in the center and tend to colocalize with favorable survival outcome (B). The outer ring is mostly composed of lower-diversity samples, which show a higher presence of Escherichia-Shigella, Enterococcus, Enterobacter, and Streptococcus when color-coded for the most abundant taxon detected (C). A similar trend can be observed for the onset of aGVHD (aGVHD) (D), especially grade 3 to 4 aGVHD. Samples from all 5 institutions are well distributed across the t-SNE space (E).

