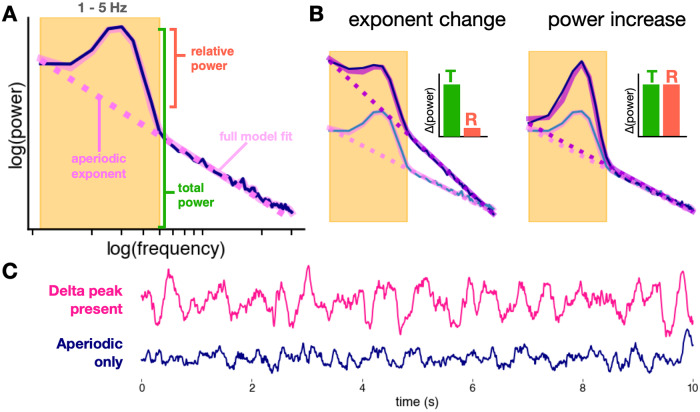
Fig. 1. Hypothesis (aperiodic vs. oscillatory delta).
A Spectral parameterization quantifies the power spectrum as a composite of periodic and aperiodic components. Unlike traditional band power measures that conflate periodic and aperiodic activity, oscillatory power is defined as relative power above the aperiodic component (pink dashed line). B Increases in the aperiodic exponent can cause apparent increases in total (T) band power, while power relative (R) to the aperiodic component remains unchanged. True increases in oscillatory power show increases in both total power and relative power. C Delta in the EEG trace vs. aperiodic activity. EEG with delta oscillations (where a delta peak is present in the spectra) is visibly different from EEG with only aperiodic activity, though both can qualitatively look like EEG “slowing”. Only 4/9 EEG patients had delta peaks in their spectra for every session and 6/9 had a delta peak for any session.

