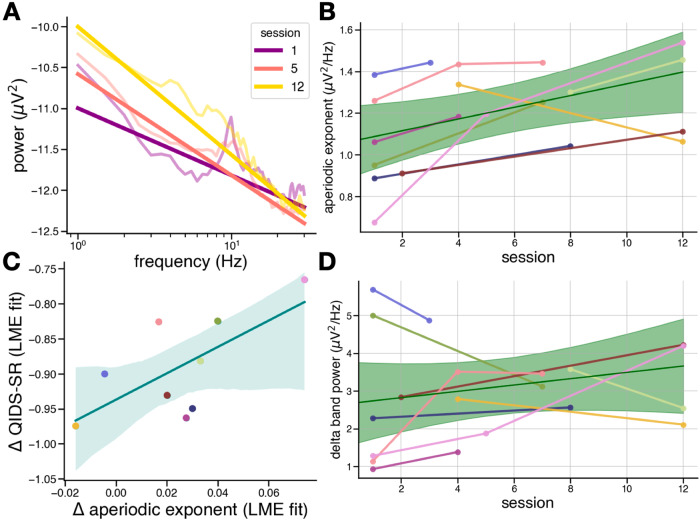
Fig. 4. Longitudinal effects.
A Power spectra and aperiodic fits (straight lines) for average frontal PSDs for a single patient at three pre-treatment sessions. B Aperiodic exponent significantly increases longitudinally (β = 0.027, p = 0.018). The solid green line is the population-level model prediction, with shaded areas representing the 95% confidence interval of the prediction. C Across patients, improvements in QIDS-SR scores, as quantified by the coefficients of a linear mixed-effects (LME) model fit to the data, are correlated to the increase in aperiodic exponent (r = 0.68, p = 0.046); however, this correlation should be interpreted with caution due to the small sample size. The solid teal line is the population-level model prediction, with shaded areas representing the 95% confidence interval of the prediction. D Delta band power does not significantly change longitudinally (β = 0.072, p = 0.269).

