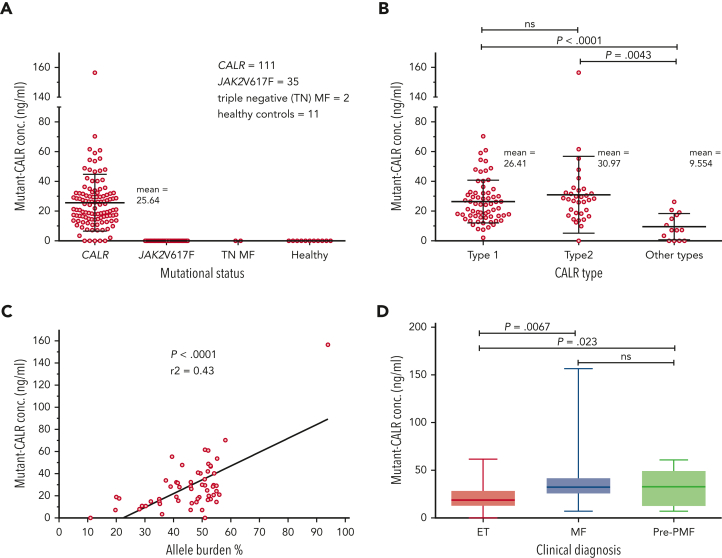
Figure 1.
Quantification of mutant CALR in plasma from patients with MPN and correlation of protein levels to the disease state. (A) Quantification of free mutant CALR proteins in the plasma from patients with MPN, separated by their mutational status, and assayed by ELISA. Red bars represent mean ± standard deviation (SD). (B) The same ELISA results for patients with mutated CALR as shown in panel A, separated according to their mutation type. Red bars represent mean ± SD. (C) XY plot of the allele burden of each patient by their level of free plasmatic mutant CALR. A linear regression was applied and shows a statistically significant correlation between the 2 parameters. (D) The same ELISA results for patients with mutated CALR as shown in panel A, represented as a box and whisker plot, arranged according to patient disease status. All statistical analysis (using the Prism6 software) were performed by the unpaired t test. conc., concentration; MF, myelofibrosis; ns, not significant; TN, triple-negative.

