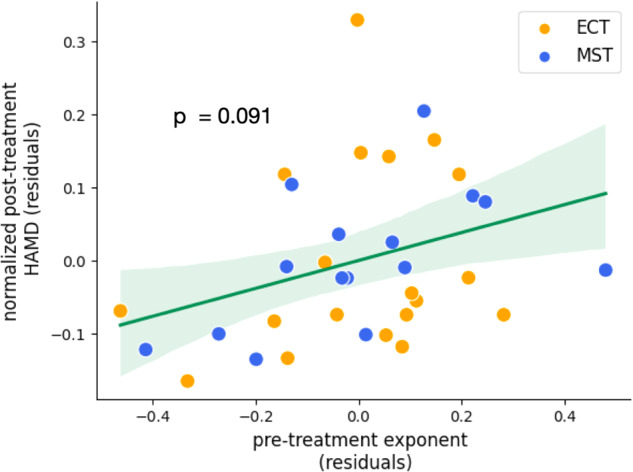
Fig. 5. Partial regression analysis – baseline exponent and treatment outcome.

Partial regression of combined ECT and MST datasets showing a positive trending relationship between patients’ aperiodic exponent at baseline and clinical outcome, as measured by normalized HAM-D (β = 0.30, p = 0.091, 95% CI[−0.05, 0.657]). Here, patients whose baseline aperiodic exponent is lower, visible in a flatter pre-treatment power spectrum, show lower post-treatment symptom severity.
