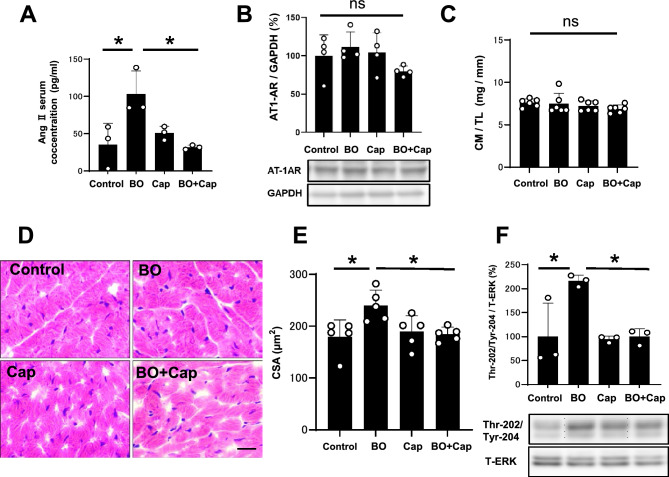
Figure 2.
Effects of BO on the activation of RAS and cardiac hypertrophy. (A) Serum Ang II levels were significantly increased in the BO group compared to the control, and the increase was significantly suppressed by Cap (n = 3 each). *P < 0.05 by one-way ANOVA followed by the Tukey–Kramer post hoc test. (B) AT1 expression was similar in all four groups (n = 4 each). NS, not significantly different by one-way ANOVA followed by the Tukey–Kramer post hoc test. Images of full-size immunoblots are shown in Supplementary Fig. 2. (C) No significant difference in heart size in terms of cardiac muscle mass (CM) per tibial length ratio (TL) (mg/mm) at 2 weeks after BO treatment (n = 6 each). (D and E) Representative images of HE-stained sections of cardiac muscle in the Control (upper left), BO (upper right), Cap (lower left) and BO + Cap (lower right) groups. Scale bar = 20 μm (D). CSA, another index of hypertrophy, was slightly but significantly increased in the heart of BO mice, and the increase was suppressed by Cap (n = 5 each) (E). (F) Expression of ERK1/2 phosphorylation was significantly increased in the BO, and the increase was suppressed by Cap (n = 3 each). *P < 0.05 by one-way ANOVA followed by the Tukey–Kramer post hoc test. Images of full-size immunoblots are shown in Supplementary Fig. 3. Data are presented as mean ± SD and dots show individual data.

