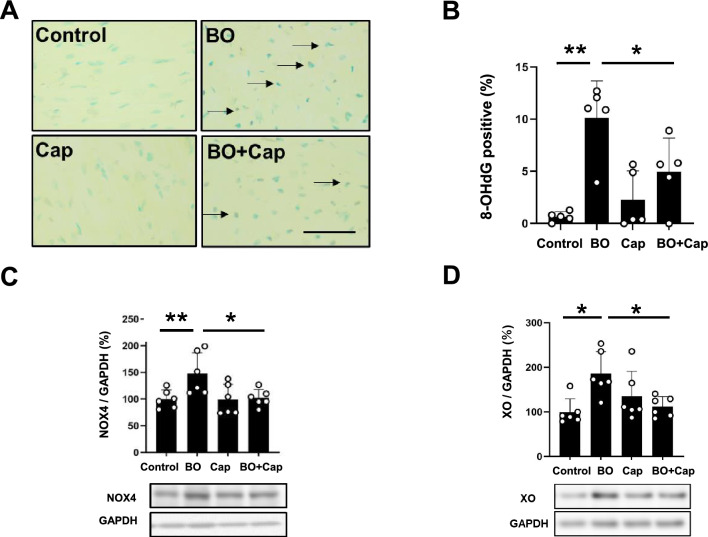
Figure 5.
Effects of Cap on BO-induced oxidative stress in cardiac muscle. (A) Representative immunohistochemical images of oxidative DNA damage (8-OHdG) in cardiac muscle in the Control (upper left), BO (upper right), captopril (Cap; lower left) and BO + Cap (lower right) groups. Scale bar = 5 μm. (B) 8-OHdG-positive nuclei were significantly increased in the BO group (n = 5), but this increase was blocked in the BO + Cap group (n = 5). *P < 0.05, **P < 0.01 by one-way ANOVA followed by the Tukey–Kramer post hoc test. (C) NOX4 expression was significantly increased in the BO group (n = 6), and this increase was significantly blocked in the BO + Cap group (n = 6). *P < 0.05 by one-way ANOVA followed by the Tukey–Kramer post hoc test. Data are presented as mean ± SD and dots show individual data. Images of full-size immunoblots are shown in Supplementary Fig. 9. (D) Expression of XO was significantly increased in the BO group (n = 6), and this increase was significantly blocked in the BO + Cap group (n = 6). *P < 0.05 by one-way ANOVA followed by the Tukey–Kramer post hoc test. Data are presented as mean ± SD and dots show individual data. Images of full-size immunoblots are shown in Supplementary Fig. 10.

