Figure 5.
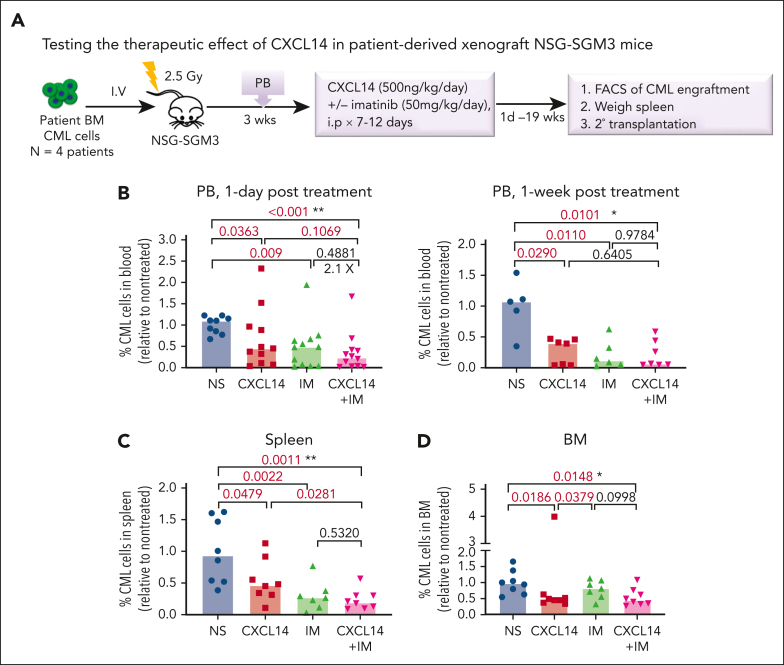
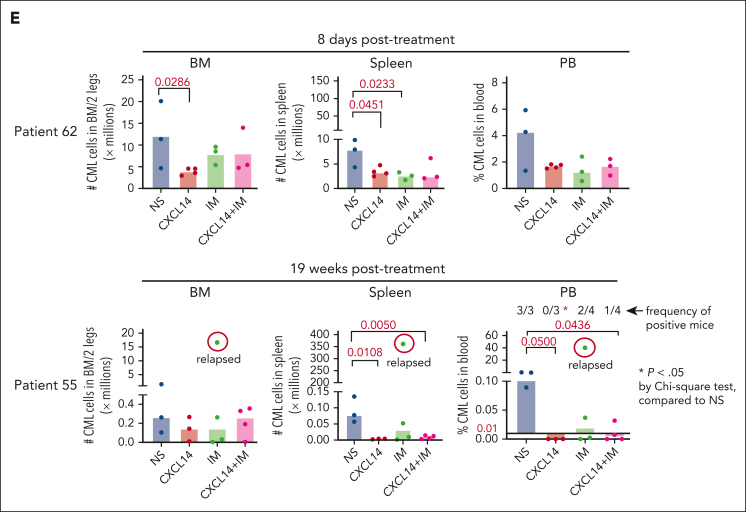
CXCL14 treatment in vivo suppresses CML cell engraftment in a patient-derived xenograft NSG-SGM3 mouse model. (A) Experimental design for assessing the in vivo effect of CXCL14 and IM on CML cell growth by xenograft transplantation into NSG-SGM3 mice. Primary BM MNCs from patients with CML were transplanted via tail vein into the NSG-SGM3 mice. Peripheral blood was collected at 3 weeks after transplantation to examine CML engraftment before treatment. The mice with similar CML engraftment were subjected to daily intraperitoneal injections of saline (NS), CXCL14, IM, or the combination for 7 to 12 days at the indicated doses. From 1 day to 19 weeks after the last injection, CML engraftment in the BM, spleen, and PB of the recipient mice were analyzed by FACS. (B-D) The relative frequencies of the CML cells in the recipient PB (B) at 1 day and 1 week after 7 to 12 days of treatment, and in the spleen (C) and BM (D) at the end points (1-8 days after treatment). The numbers in the panels are P values determined by unpaired t test; or ∗P < .05, ∗∗P < .01, by one-way analysis of variance Kruskal-Wallis test. (E) The CML engraftment derived from patients with CML with suboptimal response to TKI. The BM, spleen, and blood in the recipient mice were analyzed at the end point (when 1 of the mice showed symptoms) after 10- to 12-day treatments. The CML cell numbers were calculated based on the percentage of human CD45+ cells in each tissue type. The numbers in the lower right panel are frequencies of the mice with detectable CML cells (>0.01% of hCD45+ cells), defined based on the background staining in the mice that did not undergo transplantation. TKI suboptimal response: the patients who failed to reach <1% in BCR-ABL1 expression by polymerase chain reaction in blood by 6 months after TKI treatment initiation. The P values in the panels were determined by unpaired t test. Data were from 3 independent experiments on 3 patients with CML. Each dot represents CML engraftment in a single recipient mouse. Horizontal bars indicate median values. See also supplemental Figures 7-8.


