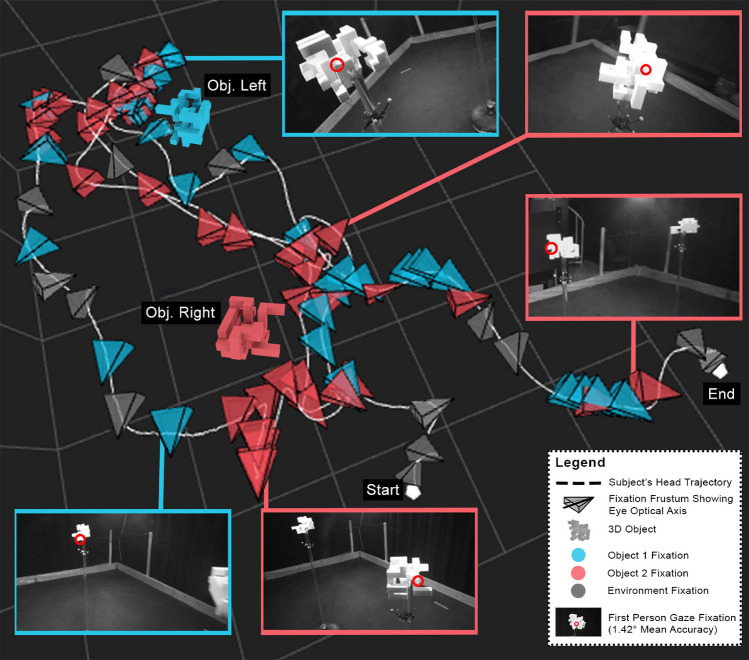
Figure 4.
A visualization of the recorded data from PESAO. The subject’s movement is plotted as a dashed line in white, and fixations are illustrated as colour-coded frustum—red, blue and grey for fixations on object 1, object 2, and environment (i.e., not on an object, likely to understand spatial layout for locomotion) , respectively. Selected fixation frusta are annotated with snapshots of the subject’s first-person view and the gaze at a particular fixation (red circle). In this example, the objects are the same, of complexity level , they differ in pose by , and the subject started from position . This visualization was created using PESAO25.

