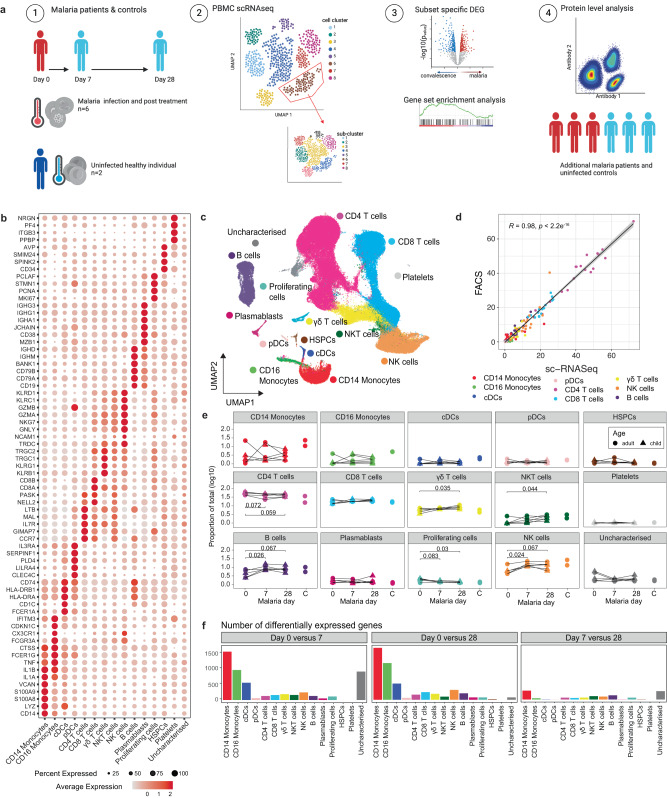
Fig. 1. Single cell transcriptional landscape of malaria infection.
a A schematic outline depicting workflow for sample collection and scRNAseq analysis. PBMCs were collected from P. falciparum malaria patients at day 0 (n = 5), and at day 7 (n = 6) and 28 (n = 6) post treatment and from healthy endemic controls without malaria (EC, n = 2). Live PBMCs were analysed by 3’ 10X Chromium single cell sequencing, and cell types identified. For each cell type and sub-cluster, genes with differential expression between days were identified and analysed. Key findings were confirmed at the protein level in additional patients. Created with BioRender.com. b Dot plot of the mean expression of marker genes used to annotate cell types. c UMAP of all cells in integrated analysis. Cells are coloured by cell subtypes. d Correlation between relative proportion of cells identified by scRNAseq and flow cytometry analysis (data from n = 19, from day 0 n = 5, day 7 n = 6, day 28 n = 6, endemic controls n = 2). Pearson’s R and p (two-sided) is indicated. Error is 95% confidence interval. e Relative proportion of identified subsets from scRNAseq analysis as a proportion of total cells analysed per timepoint/individual at day 0 during malaria, and day 7-, and 28-days post-treatment, and in healthy endemic control individuals. P-value (two-sided) is calculated by Mann Whitney U test between day 0 and subsequent time points. f Number of DEGs for each cell type between day 0/7, day 0/28 and day 7/28. See also Supplementary Fig. 1-2 and Supplementary Tables 1-2 and Supplementary Data 1-2. Source data are provided as a Source Data file.

