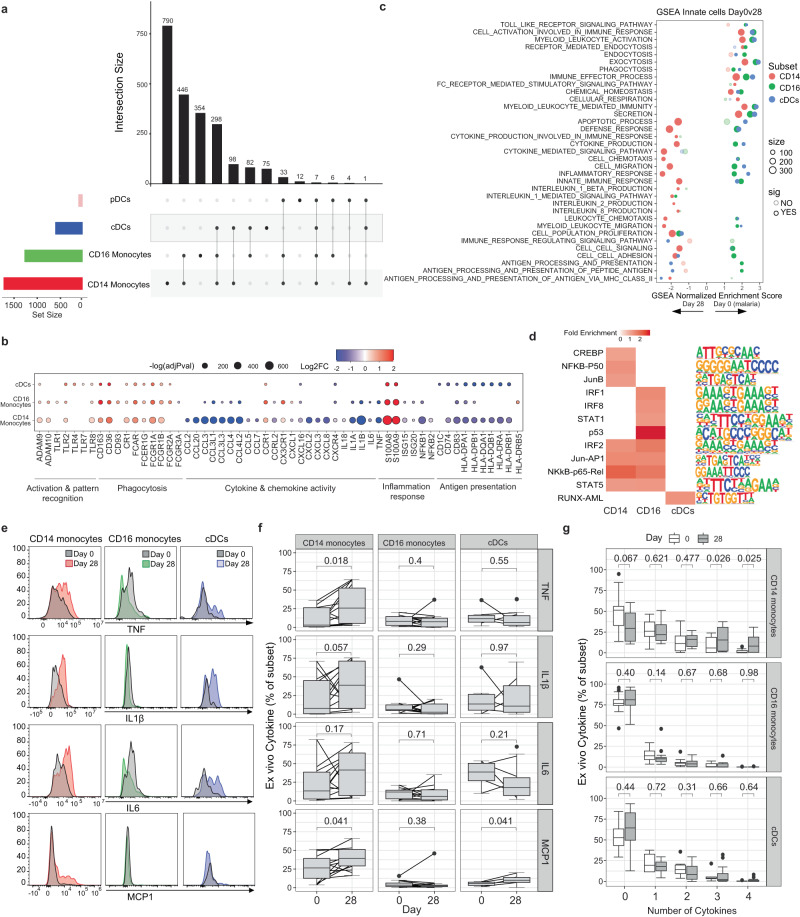
Fig. 2. Immuno-suppressive signatures of innate cells during malaria.
DEGs in CD14+ and CD16+ monocytes, and cDCs and pDCs of day 0 compared to day 28 were identified (n = 5 day 0, n = 6 day 28). a Upset plot of shared and subset specific DEGs of each subset identified between day 0 and day 28. b DEGs of interest in monocytes and cDCs. Genes with known monocyte function are indicated. Log transformed p values (Wilcox test, two-sided, Bonferroni correction). c GSEA of DEGs in CD14+ and CD16+ monocytes and cDCs. d Common and unique upstream regulators of DEGs in CD14+ and CD16+ monocytes and cDCs. e Ex vivo secretion of TNF, IL1β, IL6 and MCP1 was measured in CD14+ and CD16+ monocytes, and cDCs. Representative cytokine expression of a single individual at day 0 compared to day 28 in each subset. Subset gates from each sample were excluded if <50 events (CD14+ monocytes – Day 0 n = 15, Day 28 n = 14; CD16+ monocytes – Day 0 n = 14, Day 28 n = 14; cDCs – Day 0 n = 6, Day 28 n = 14). f Cell subset level expression of cytokines. Box and whisker plots indicate first and third quartiles for the hinges, median line, and lowest and highest values no further that 1.5 interquartile range from the hinges for whisker lines. g Frequency of cell subset expressing none or a combination of the 4 cytokines: TNF, IL1β, IL6 and MCP1. P-value (two-sided) indicated is calculated by Mann-Whitney U test. See also Supplementary Fig. 3-4 and Supplementary Tables 1-2, Supplementary Data 1-2. Source data are provided as a Source Data file.

