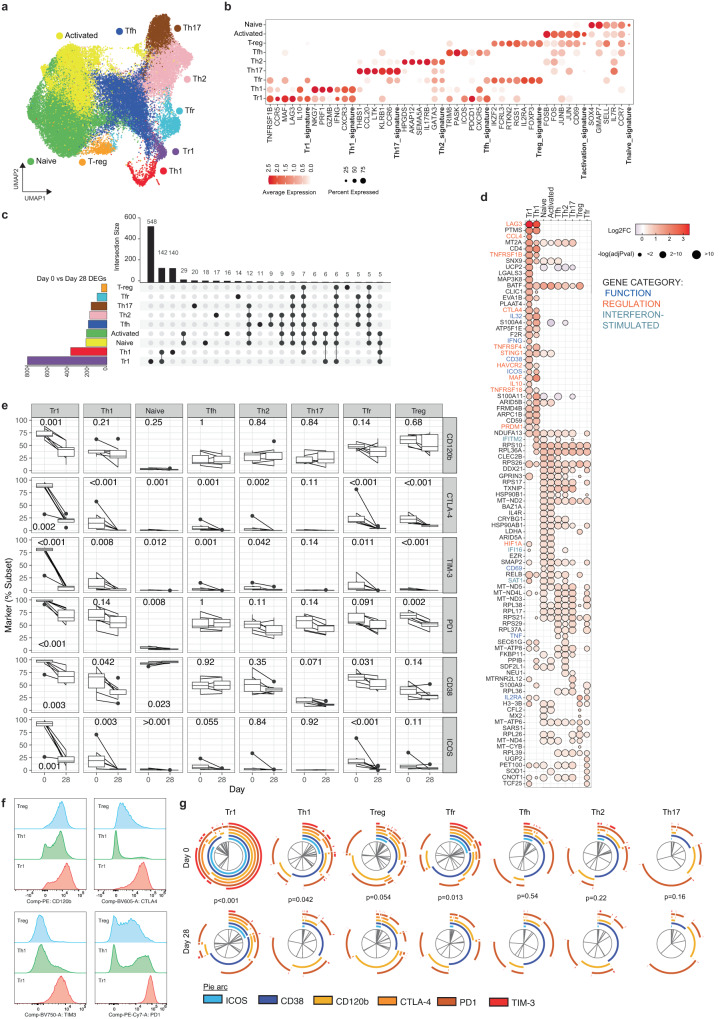
Fig. 5. Tr1 CD4 T cells dominate the response during malaria.
a/b Nine subsets of CD4 T cells were identified based on unsupervised clustering and categorized based on canonical marker expression and T helper expression signatures. c DEGs in CD4 T cell subsets at day 0 (n = 5) compared to day 28 (n = 6) were identified. The number of shared and subset specific DEGs indicated in Upset plot. Overlaps of >5 genes are shown. d Top upregulated 20 DEGs in CD4 T cell subsets. Genes with known roles in regulation and/or function are indicated. Log transformed p values (Wilcox test, two-sided, Bonferroni correction). PBMCs from patients with P. falciparum malaria (day 0, n = 7) and convalescent malaria patients 28-days post-infection (day 28, n = 9) were analysed ex vivo to detect CD4 T and measure protein expression of identified genes by flow cytometry. e Expression of proteins related to function and regulation, shown as positive frequencies of CD4 T cell subsets: naive (CD45RA+ ), Tr1 (CD45RA-LAG3+CD49b+ ), Treg (CD45RA-Tr1-/FOXP3+CD127lo), Tfh (CD45RA-Tr1-/Treg-/CXCR5+ ), Tfr (CD45RA-Tr1-/Treg+ /CXCR5+ ), Th1 (CD45RA-Tr1-/Treg-/CXCR5-/CXCR3+CCR6-), Th2 (CD45RA-Tr1-/Treg-/CXCR5-/CXCR3-CCR6-) and Th17 (CD45RA-Tr1-/Treg-/CXCR5-/CXCR3-CCR6+ ). Box plots show the median and IQR of volunteers, lines represent paired observations, P values (two-sided) indicated are calculated by Mann-Whitney U test (day 0 n = 7, day 28 n = 9). Box and whisker plots indicate first and third quartiles for the hinges, median line, and lowest and highest values no further that 1.5 interquartile range from the hinges for whisker lines. f Concatenated histograms normalised to mode show expression of gene-related proteins within CD4 T cell subsets. g Co-expression of proteins related to function and regulation of CD4 T cell subsets analysed in SPICE. Pie graphs comparisons performed by Permutation test (day 0 n = 7, day 28 n = 9). See also Supplementary Fig. 13-17, Supplementary Table 5, and Supplementary Data 7-8. Source data are provided as a Source Data file.

