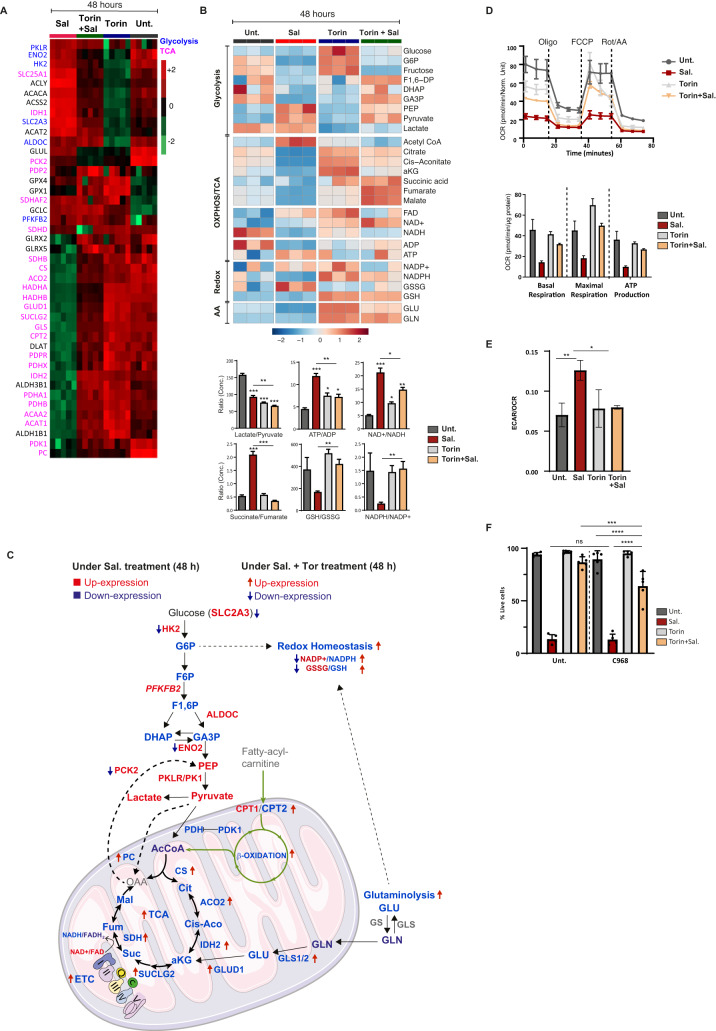
Fig. 4. mTOR inhibition interferes with Sal-mediated enhanced aerobic glycolysis and restores the mitochondrial-associated metabolic pathways.
A Heatmap comparing relative levels of proteins related to TCA cycle (written in pink) and glycolysis (written in blue) in HMLER CD24L cells in response to Sal, or Tor. alone, and combination treatments for 48 h. Color key indicates protein expression value (green: lowest; red: highest). Proteins were clustered using Perseus software. B Upper: Heatmap comparing relative levels of metabolites related to OXPHOS or TCA cycle and to glycolysis and also to glutaminolysis in HMLER cells in response to Sal, or Tor. alone, and combination treatments for 48 h. Color key indicates metabolite expression value (blue: lowest; red: highest). Metabolites were clustered using Metaboanalyst software. Lower: Graphs represent the mean of lactate/pyruvate, ATP/ADP, NAD + /NADH, Succinate/Fumarate ratios indicating the use of glycolysis or OXPHOS. GSH/GSSG and NADPH/NADP+ ratios are indicators of oxidative stress. Two tailed and unpaired student’s t test. *p < 0.05; **p < 0.01; ***p < 0.001. C Summary of the differential level of metabolites and proteins associated with the OXPHOS/TCA cycle, with glycolysis, with b-oxidation, with glutaminolysis, and redox homeostasis under Sal treatment (terms) and under combination treatment (arrows). Blue and red colors indicate the downregulated and upregulated levels, respectively. D Seahorse-based measurements of OCR (upper panel) in HMLER CD24L cells incubated under treatments as indicated for 48 h, normalized to total protein levels. Upper panel: Oligomycin, carbonyl-cyanide-4-(trifluoromethoxy)phenylhydrazone (FCCP), and antimycin A were serially injected to measure ATP production, maximal respiration, and basal respiration, respectively, as indicated in the graph. E Basal ECAR/OCR ratio in HMLER CD24L cells treated as indicated for 48 h. F HMLER CD24L was treated during 96 h with either Sal (500 nM), Torin (250 nM), or a combination of both in the presence or in the absence of glutaminolysis inhibitor (C968 (20 μM)). Cell death was determined by dapi staining and flow cytometry. n = 3 independent experiments (with at least duplicate). Data are presented as: mean ± SD, ANOVA test: *p < 0.05; **p < 0.01; ***p < 0.001; ****p < 0.0001.

